Green Growth Index:
Regional Outlook
- Introduction
- Global Review
- Regional Outlook
- Country Performance
- Expert Consultations
- Ongoing applications and collaborations
- Statistical Tables
- Appendix 1 Summary of methods for the Green Growth Index
- Appendix 2 The international expert group
- Appendix 3 List of expert reviewers
- Appendix 4 The GGPM Team
- Partners
3.1 Dimension performance 2019
Green Growth Index rankings are provided for countries within
five geographic regions – Africa, the Americas, Asia, Europe, and
Oceania. To further understand the Green Growth Index results, an
in-depth analysis of each region is provided discussing the scores
of efficient and sustainable resource use, natural capital protection,
green economic opportunities, and social inclusion at a subregional
level.

3.1.1 Africa
The fGreen Growth Index includes the results for five African
subregions – Eastern, Middle, Northern, Southern, and Western
Africa. The results show that the overall regional performance is
moderate to low. Northern Africa has the highest green growth
index, as a result of high social inclusion and the best performance in green economic opportunities compared to the other subregions.
The very high scores in social equality in Morocco, Algeria, and
Tunisia as well as moderate to high country performance in green
investment support this result. However, Northern Africa also has
the lowest scores in efficient and sustainable resource use, linked to
poorer performance in efficient and sustainable energy and water
use. In comparison, the above 60 scores of Eastern, Middle, and
Western Africa (Figure 8) in this dimension is mainly attributed
to the high scores in efficient and sustainable energy use. Natural
capital protection is the most consistent across subregions, with
Eastern and Western Africa receiving high scores and having
strong performances in GHG emission reductions followed by
environmental quality. Whereas, the Northern Africa score is
affected by low values in biodiversity and ecosystem protection
(Figure 7). Among all subregions, green economic opportunities
score the lowest, except Northern Africa. Green investment
is observed to be the main contributor to the green economic
opportunities dimension, with zero or very low scores provided to
the other indicator categories. 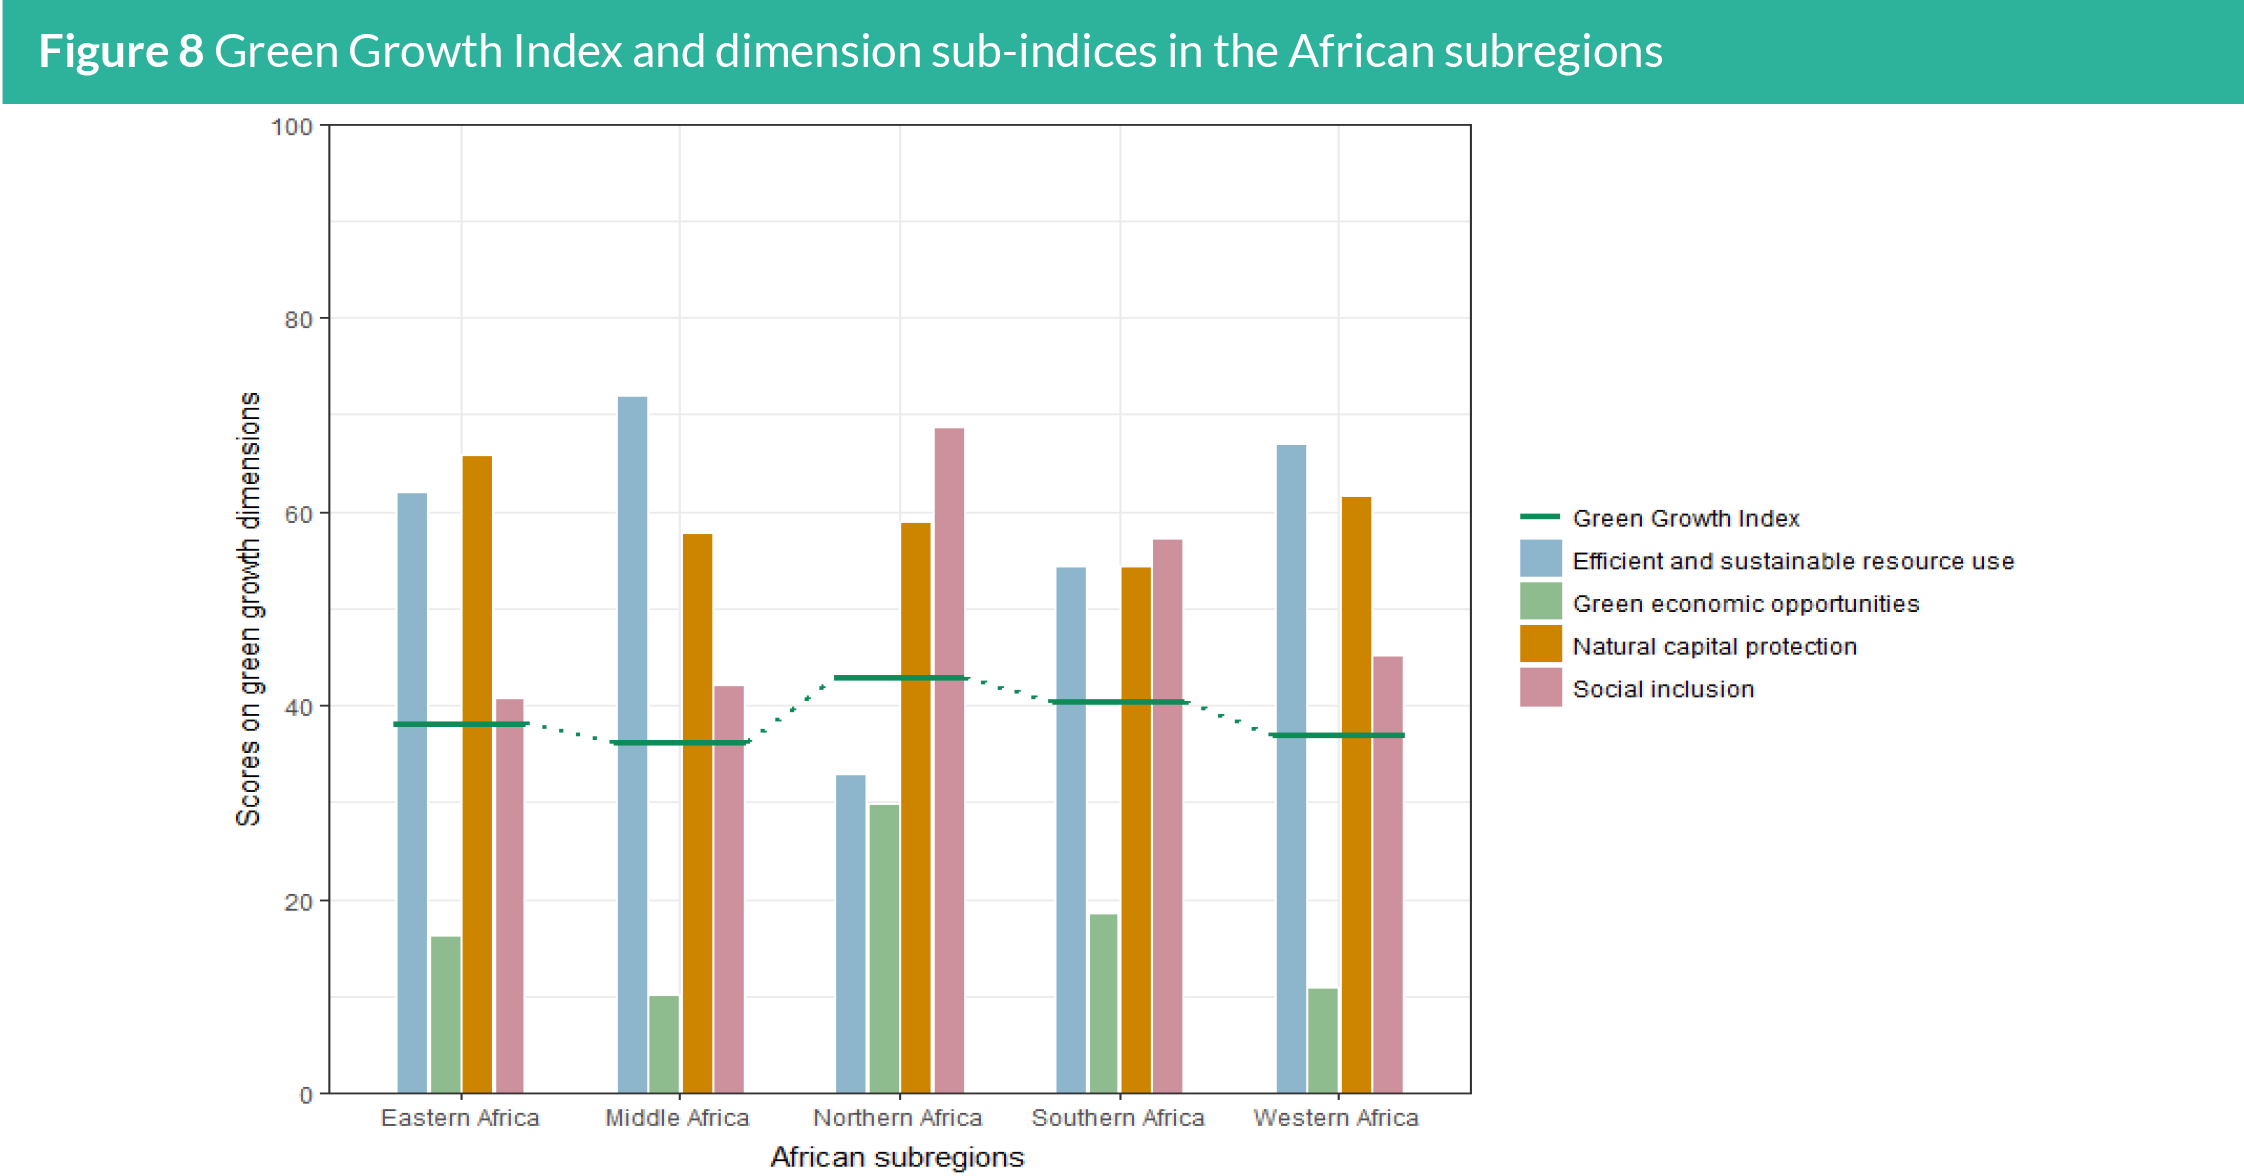
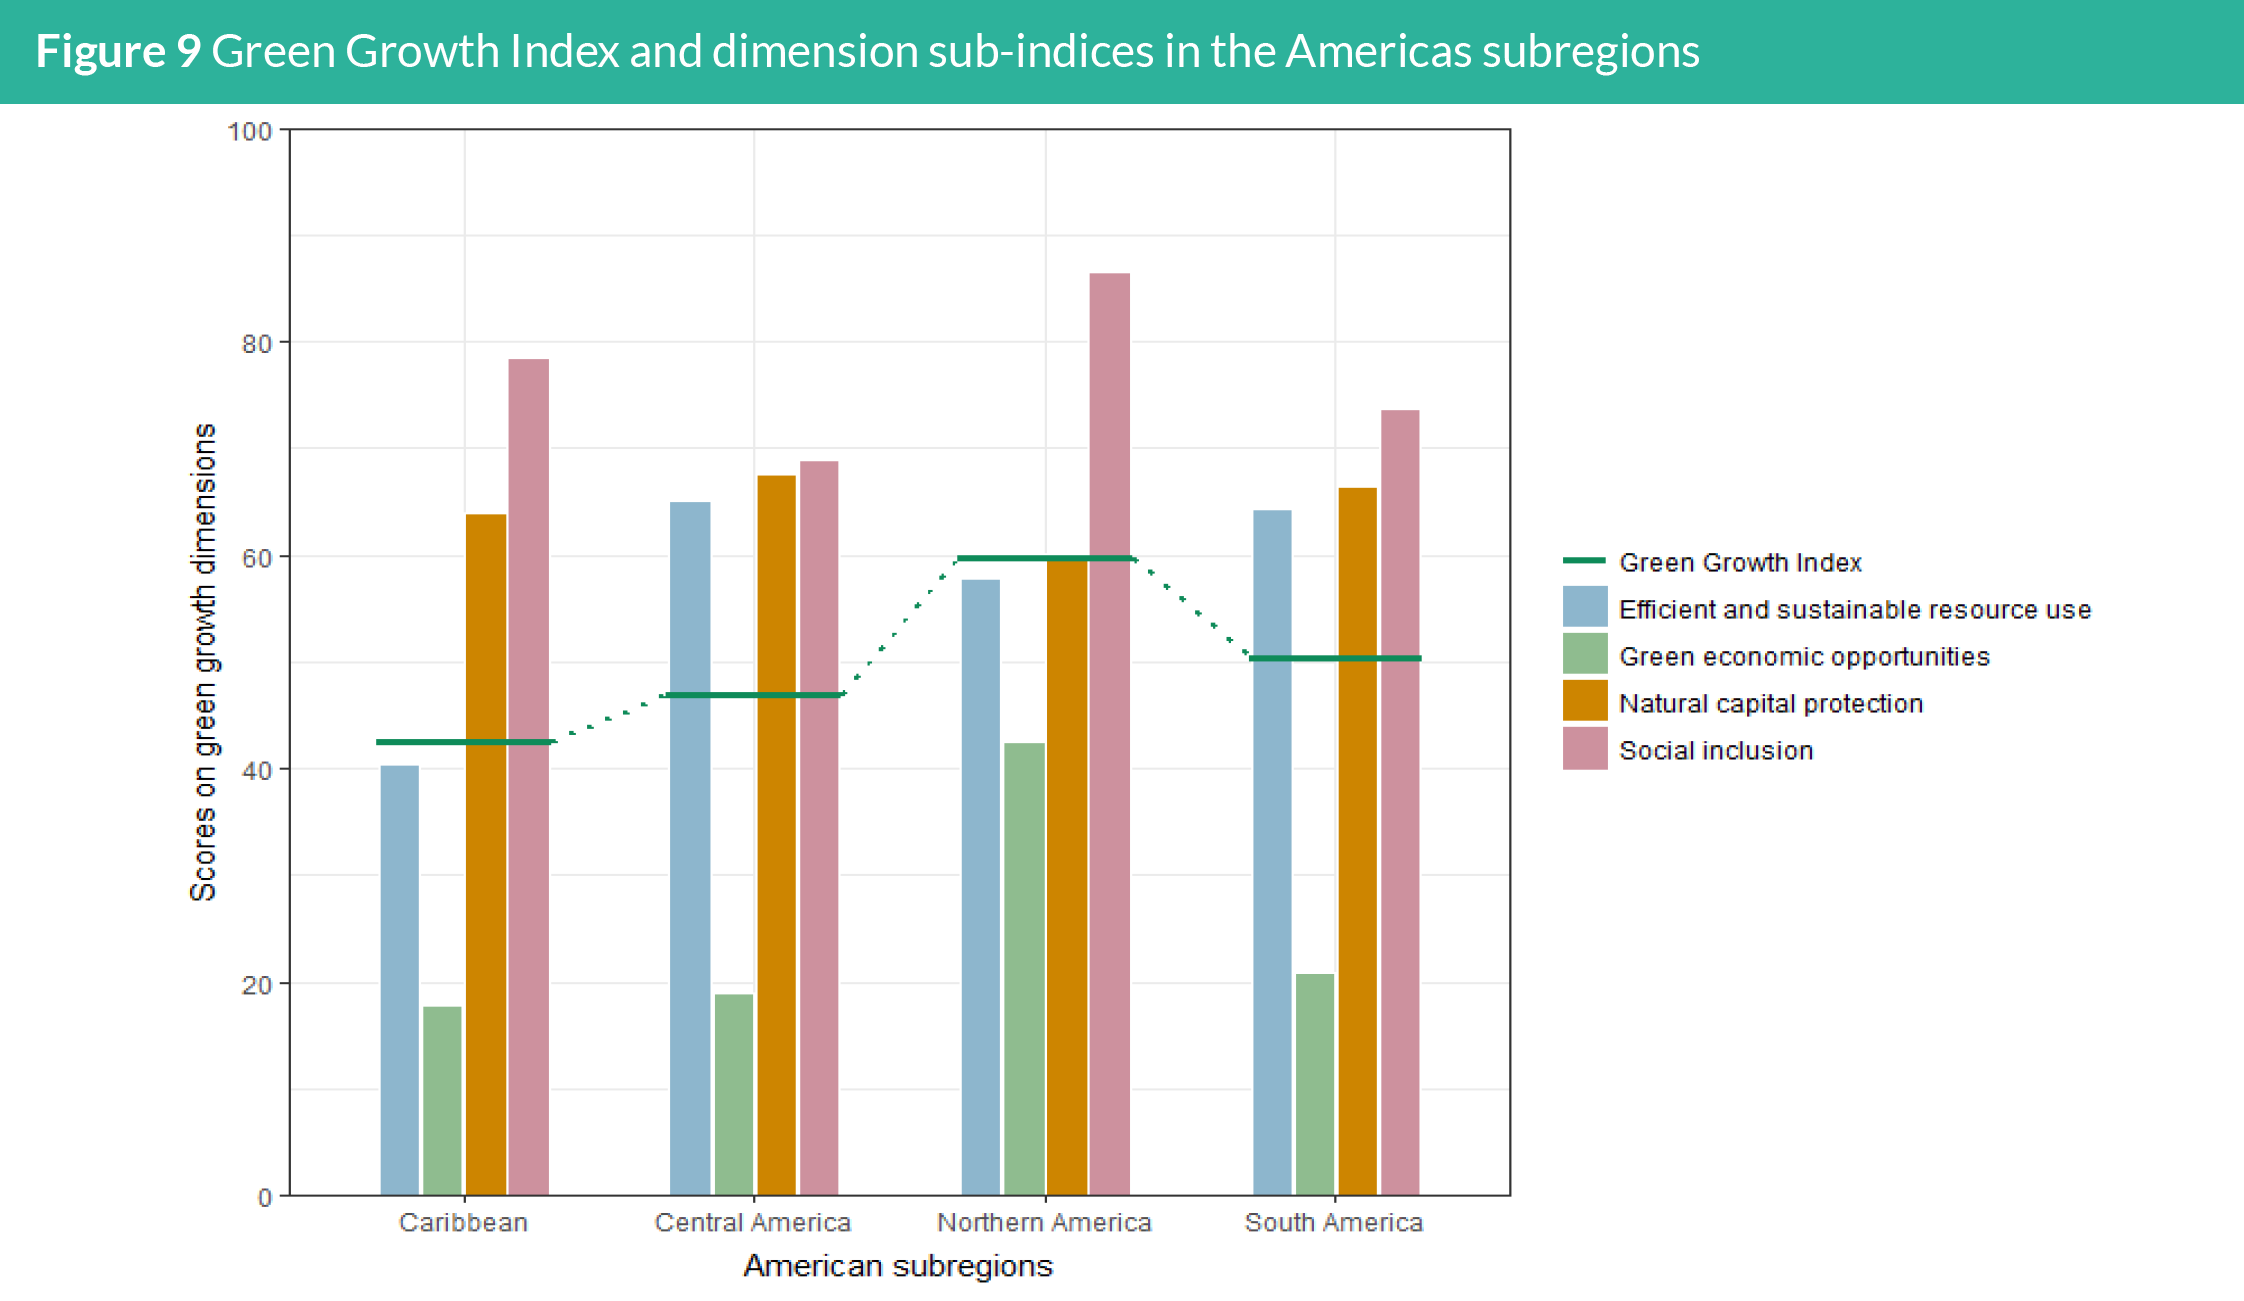
3.1.2 Americas
The Caribbean and Central, Northern, and South America are the
four subregions of the Americas. Social inclusion is the strongest
performing dimension with high scores in the Caribbean and Central and Southern America. The very high scores in Northern America can be attributed to countries such as the United States and Canada as a result of prioritizing social inclusion policies and spending on social programs. However, Northern America falls behind in the dimension of natural capital protection due to lower scores in GHG emissions and biodiversity and ecosystem protection (Figure 9).
In comparison, Central America leads the performance in natural capital protection. Consequently, being an area of the world with
high biodiversity, many countries in this region such as Mexico
and Costa Rica have higher scores for natural capital protection.
Additionally, this region also has the highest efficient and sustainable resource use scores due to higher performance in efficient and sustainable energy use and material use efficiency. South America has comparable values to Central America in terms of natural capital protection and resource efficiency; however, it does have a higher green growth score due to slightly higher scores in gender balance and social equality for social inclusion. The Caribbean has the lowest green growth index score just above 40 (Figure 9), and while this sub-region scores higher in social inclusion, this is offset by the lowest regional values in green economic opportunities and efficient and sustainable resource use. Green economic opportunities scores are also the lowest among all dimensions, with similar values observed in the Caribbean, Central America, and South America.
This is primarily attributed to green investment. On the other hand, the moderate scores in Northern America are the outcome of higher green trade and green employment scores compared to the other subregions (Figure 7).
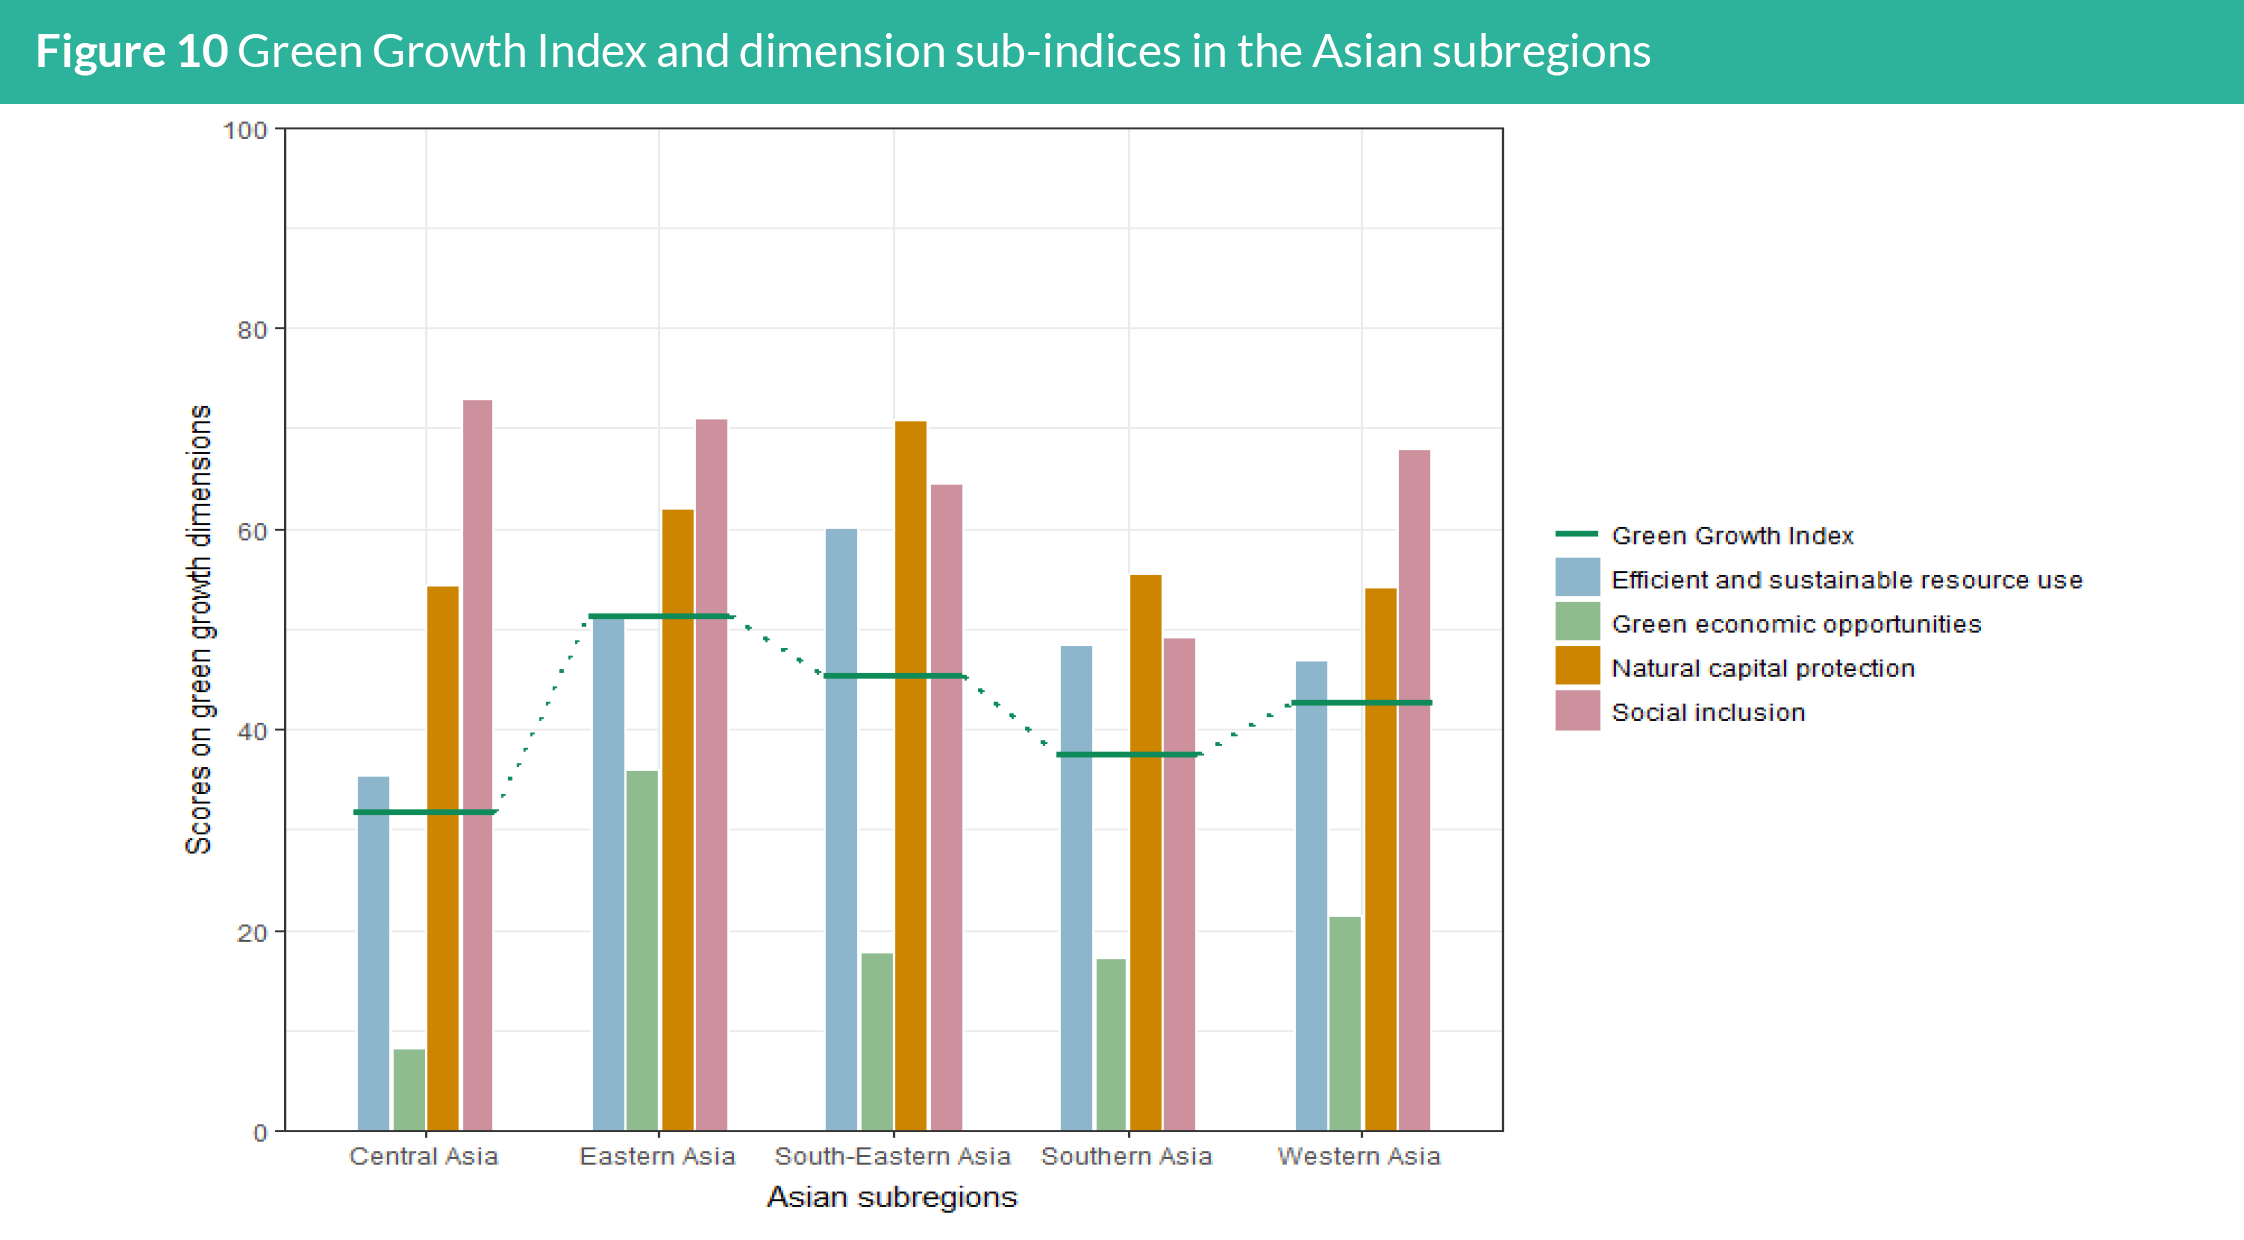
3.1.3 Asia
Asia has five subregions – Central, Eastern, South-Eastern, Southern,
and Western Asia. Green growth performance is more varied in this
region, with a large difference in index scores observed between
Eastern and Central Asia. The high social inclusion scores among all
the sub-regions are observed except for Southern Asia. The Central
Asian countries slightly taking the lead in performance for social
inclusion, with three out of the five countries scoring above 70. It
is followed by East Asia with countries such as Japan and Korea
having very high scores above 80 (Table 11). Both of these regions
show high values for access to basic services and social equity
among the individual indicators. However, Central Asia scores the
lowest in overall green growth as a result of low scores for green
economic opportunities and efficient and sustainable resource
use. Comparably, Eastern Asia has the highest green growth
performance, due to high scores in the green economic opportunities
dimension as a result of green investment and green employment
(Figure 10).
Natural capital protection performance is highest within South-
Eastern Asia, with many countries having very high scores related
to environmental quality and GHG emission reductions. Further,
this sub-region is also another global biodiversity hotspot, thus it
explains the average high score of 70 for this dimension (Figure 10).
South-Eastern Asia also has the highest efficient and sustainable
resource use score which can be attributed to having slightly
higher values in terms of efficient and sustainable energy and water
use compared with other sub-regions in Asia. The low scores for
green economic opportunities are observed among South-Eastern
Asia, followed by Southern Asia, Western Asia, then Central
Asia. Similar to other regions, green investment seems to be the
main contributing indicator towards a higher score in the green
economic opportunities dimension (Figure 7). Additionally, another
emerging trend is income-level, as it can be shown that the subregions
with a higher proportion of upper-middle to high income
classified countries have a better performance in green economic
opportunities.
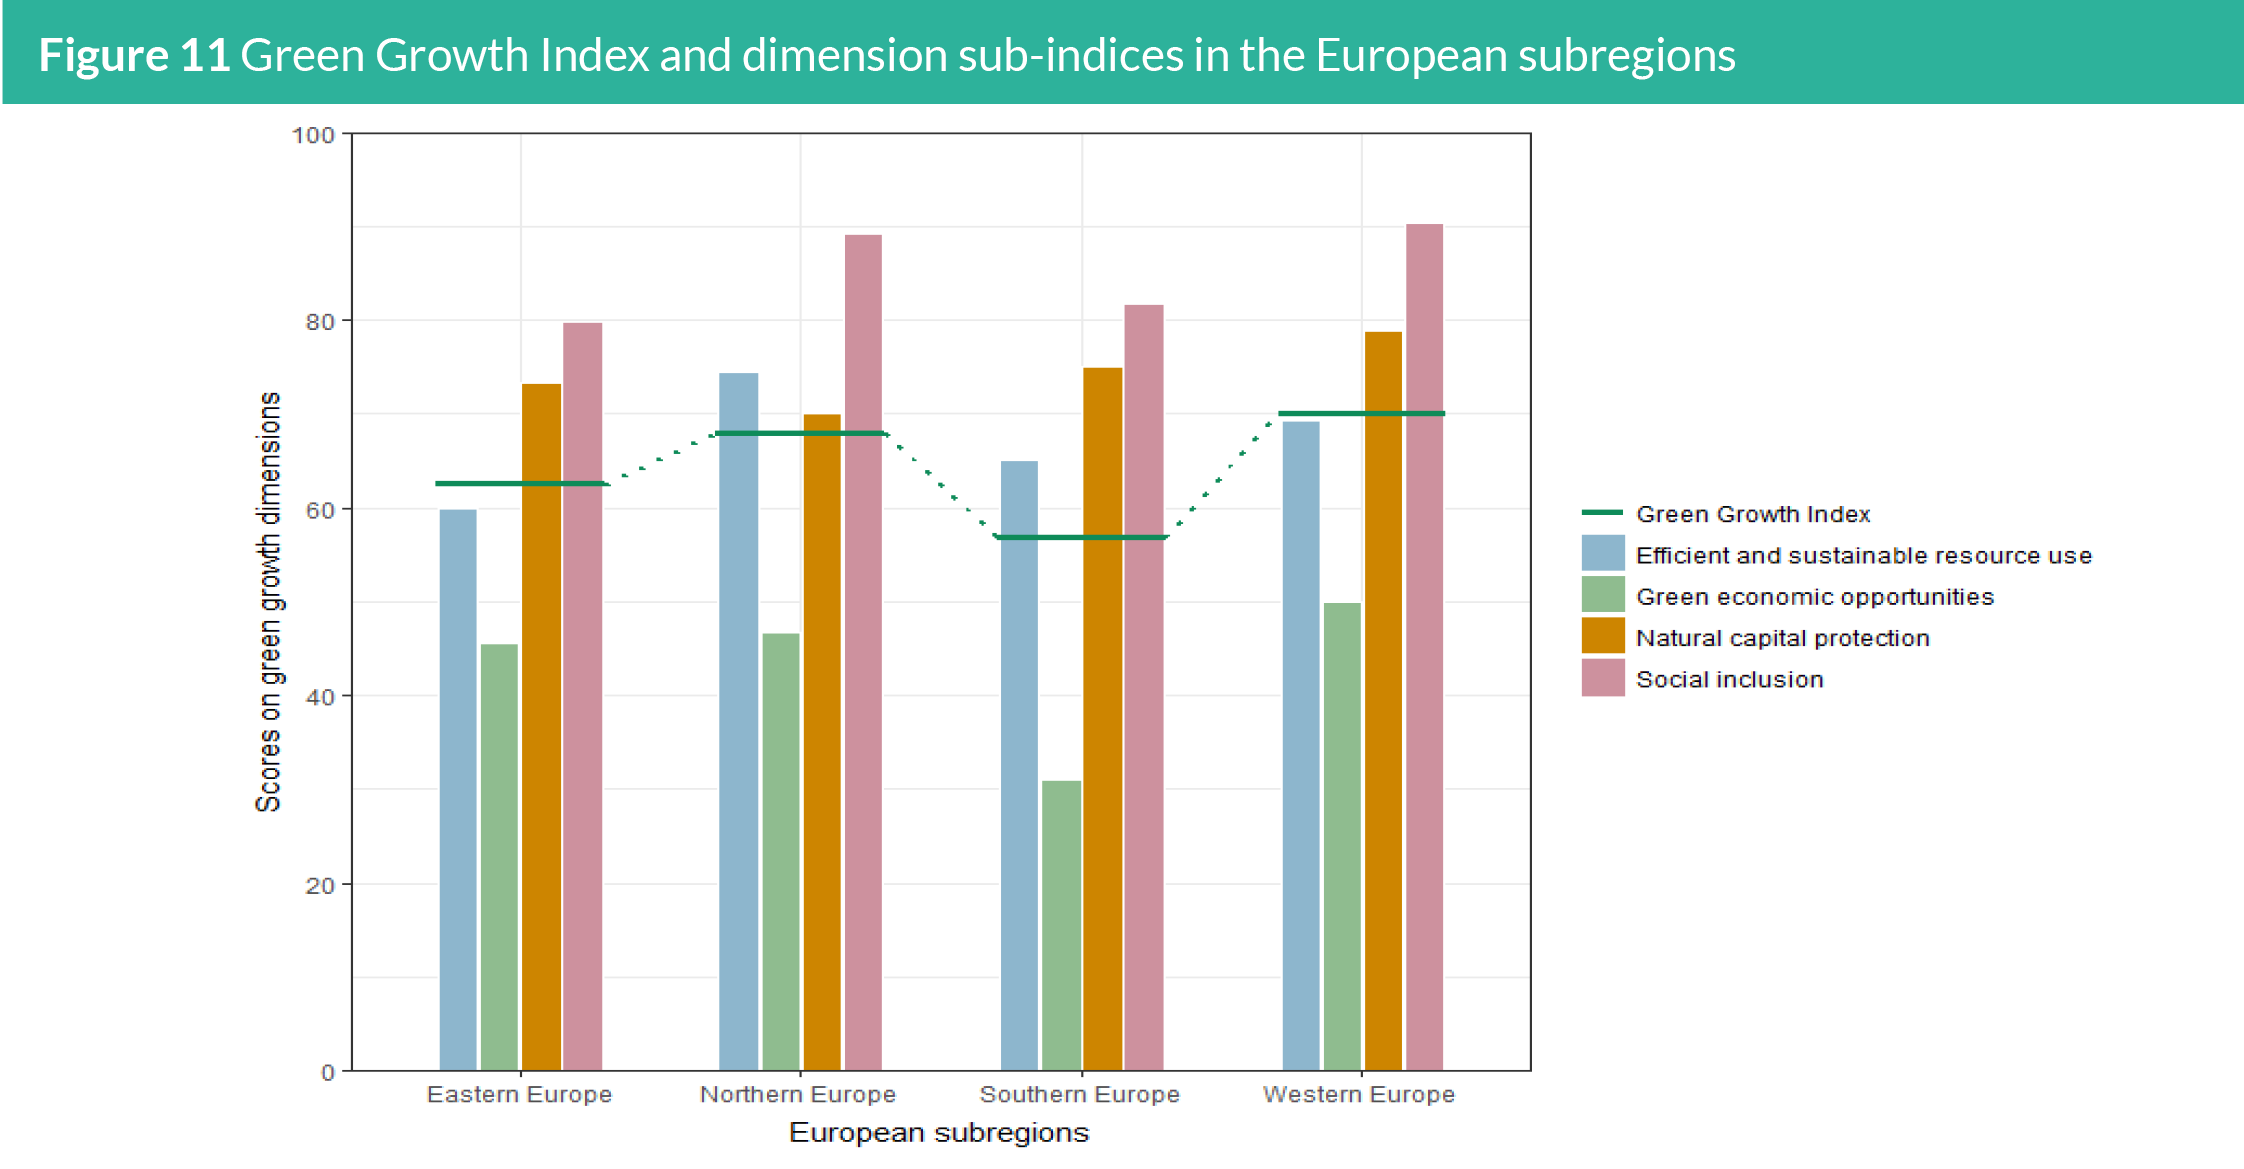
3.1.4 Europe
In comparison to other regions, Europe is the strongest performer
in green growth, with most of its subregions having a high
green growth index score. This includes four regions – Eastern,
Northern, Southern, and Western Europe. The bar plots of Eastern,
Southern, and Western Europe show the same trend in dimension
performance for social inclusion, natural capital protection, efficient
and sustainable resource use, and green economic opportunities.
Northern Europe varies by having a higher resource efficiency score
than natural capital protection (Figure 11).
Social inclusion is classified as very high in each subregion, with
the highest score in Western Europe and Northern Europe. Both
subregions also have high scores across all indicator categories.
Top countries include the Netherlands, Germany, and Norway. The
variations between these two subregions are that Western Europe
has higher scores for natural capital protection and green economic
opportunities mainly due to higher biodiversity protection, green
trade, and green employment (Figure 7). Thus, Western Europe has
the highest green growth index. Though efficient and sustainable
resource use scores are higher across the indicator categories
in Northern Europe. Scores in Eastern and Southern Europe are
also alike, however, the low score in green economic opportunities
caused by a lack of green employment and green innovation results
in Southern Europe having a lower Index score than Eastern Europe.
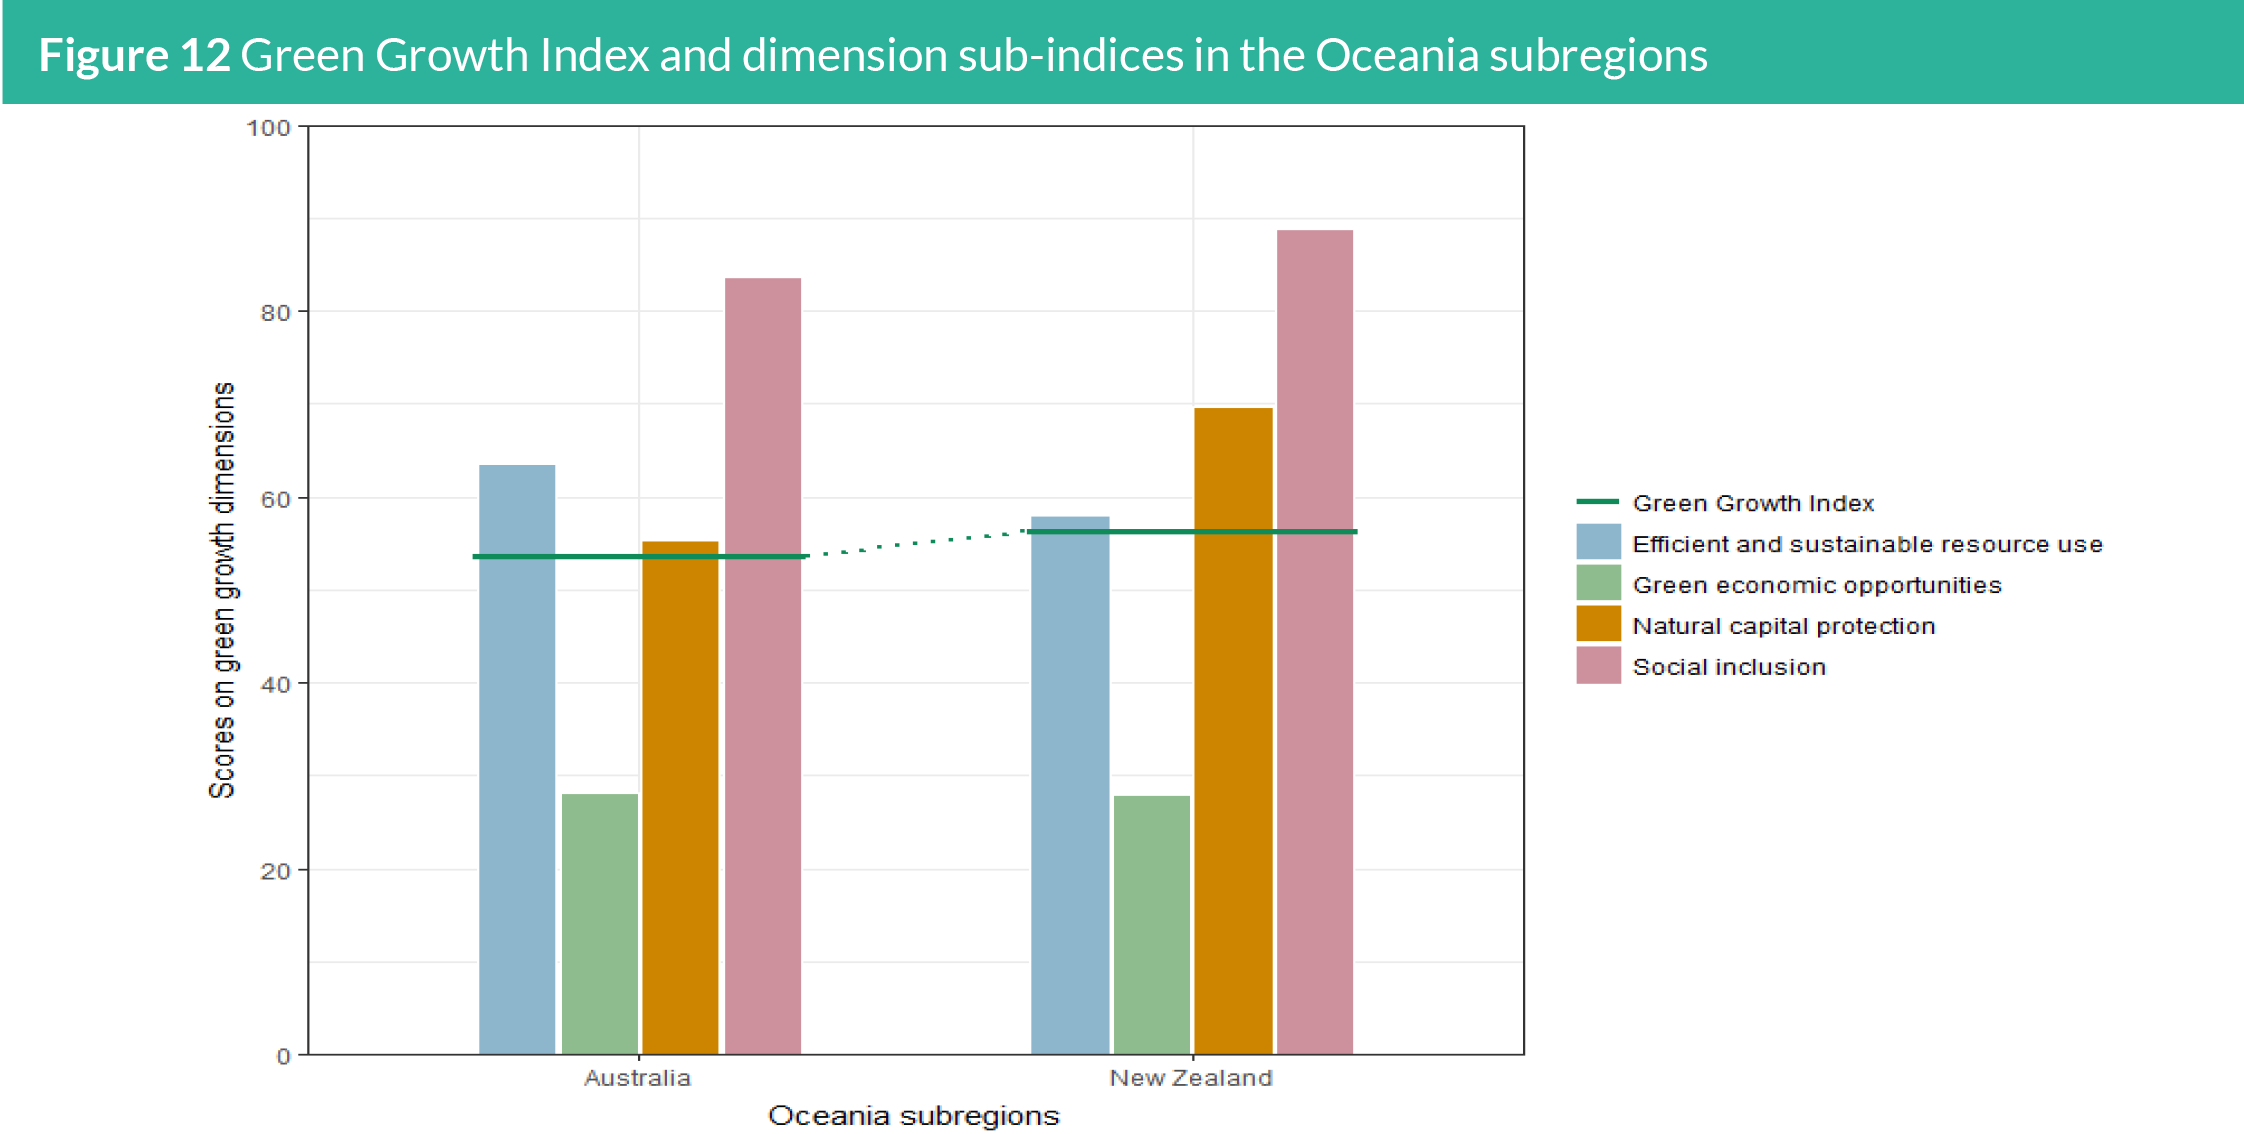
3.1.5 Oceania
Oceania is comprised of four subregions – Australia and New
Zealand, Melanesia, Micronesia, and Polynesia. Due to data
limitations with the region, a country-level analysis is presented
for Australia and New Zealand. Moderate green growth scores
are observed for both countries, with New Zealand being slightly
higher than Australia (Figure 12). Global regional trends are
further observed such as high social inclusion and low green
economic opportunity scores. There are minor differences that
appear between the efficient and sustainable resource use and
natural capital protection dimensions. The higher scores in GHG
emission reduction raise the score for the national capital protection
dimension for New Zealand over Australia. While increasing organic
agriculture in Australia has resulted in higher scores in sustainable
land use for the resource efficiency dimension.
3.2 Trend 2005-2019
3.2.1 Overall trend
In order to analyze the performances of countries in the Green
Growth Index, it is important to review the trends over the
past years which are disaggregated by region and dimension.
Understanding the reasons for the upward and downward trends
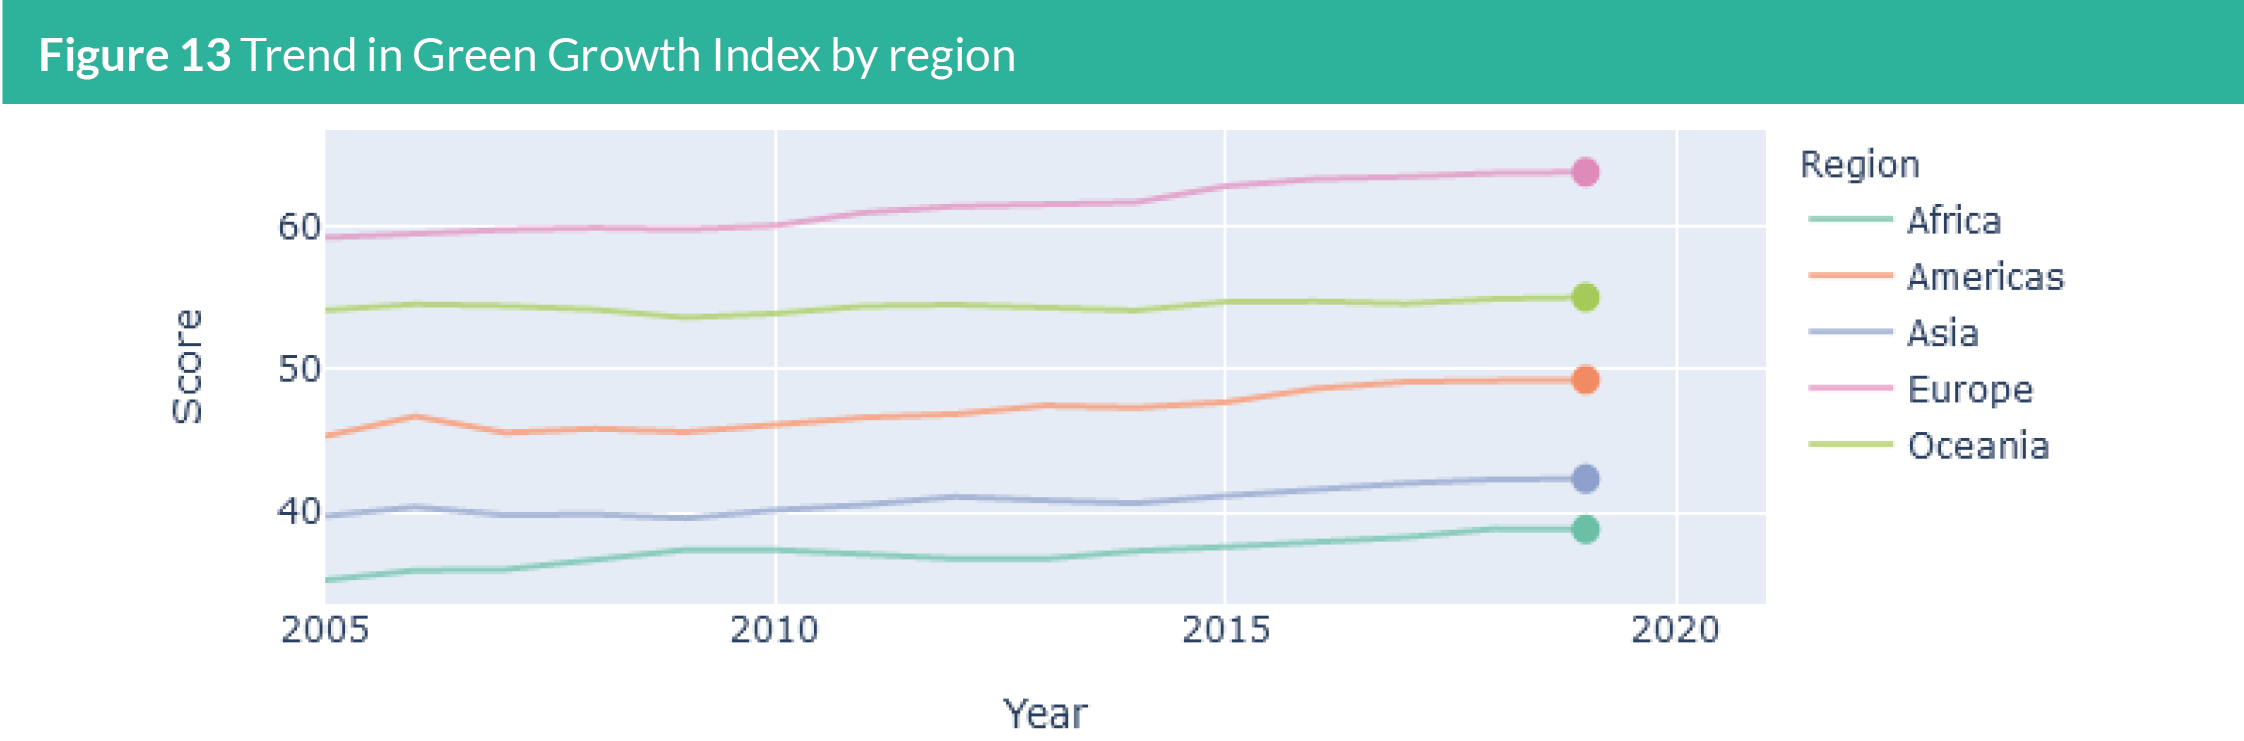
in the Index and its dimensions allows policymakers to gain insight into which areas of green growth require more attention. Figure
13 presents the trends in the Green Growth Index by region from
2005 to 2019. Europe takes the lead in the Green Growth Index
performance across time, mostly raised over the years by the
European Union’s (EU) efforts to push for a more sustainable future.
In the past decade, the EU has introduced stringent laws protecting
reserved areas, attempting to reduce pollution in cities through the
implementation of strict low emissions zones and pushing for greater
use of renewable energy. Countries in Europe have scores indicating
that they are approaching sustainability target levels as of 2019, even though the disaggregation by dimensions shows a different
picture. On the other hand, Africa and Asia remain the regions with
the lowest scores over time. African nations have scores mostly in
the low range (20-40), while Asian countries are on the lower end
of moderate scores (40-60). But, there are still improvements in
performance for these countries, particularly for the social inclusion
dimension. For the Americas, the score range is between 40-60, but
again. On the lower end of the moderate scores. This is primarily once again due to the sustained efforts to reduce poverty and
inequality in South and Central America. The score for the Americas
does not adequately reflect the performance of the United States
and Canada who individually score well above the average for the
Americas as a whole, at 60 and 59, respectively. Finally, Oceania
remains the continent that has seen the least change in score over
the past 15 years, with a score between 40-60, but on the upper end
of the average scores.
3.2.2 Trend in dimensions
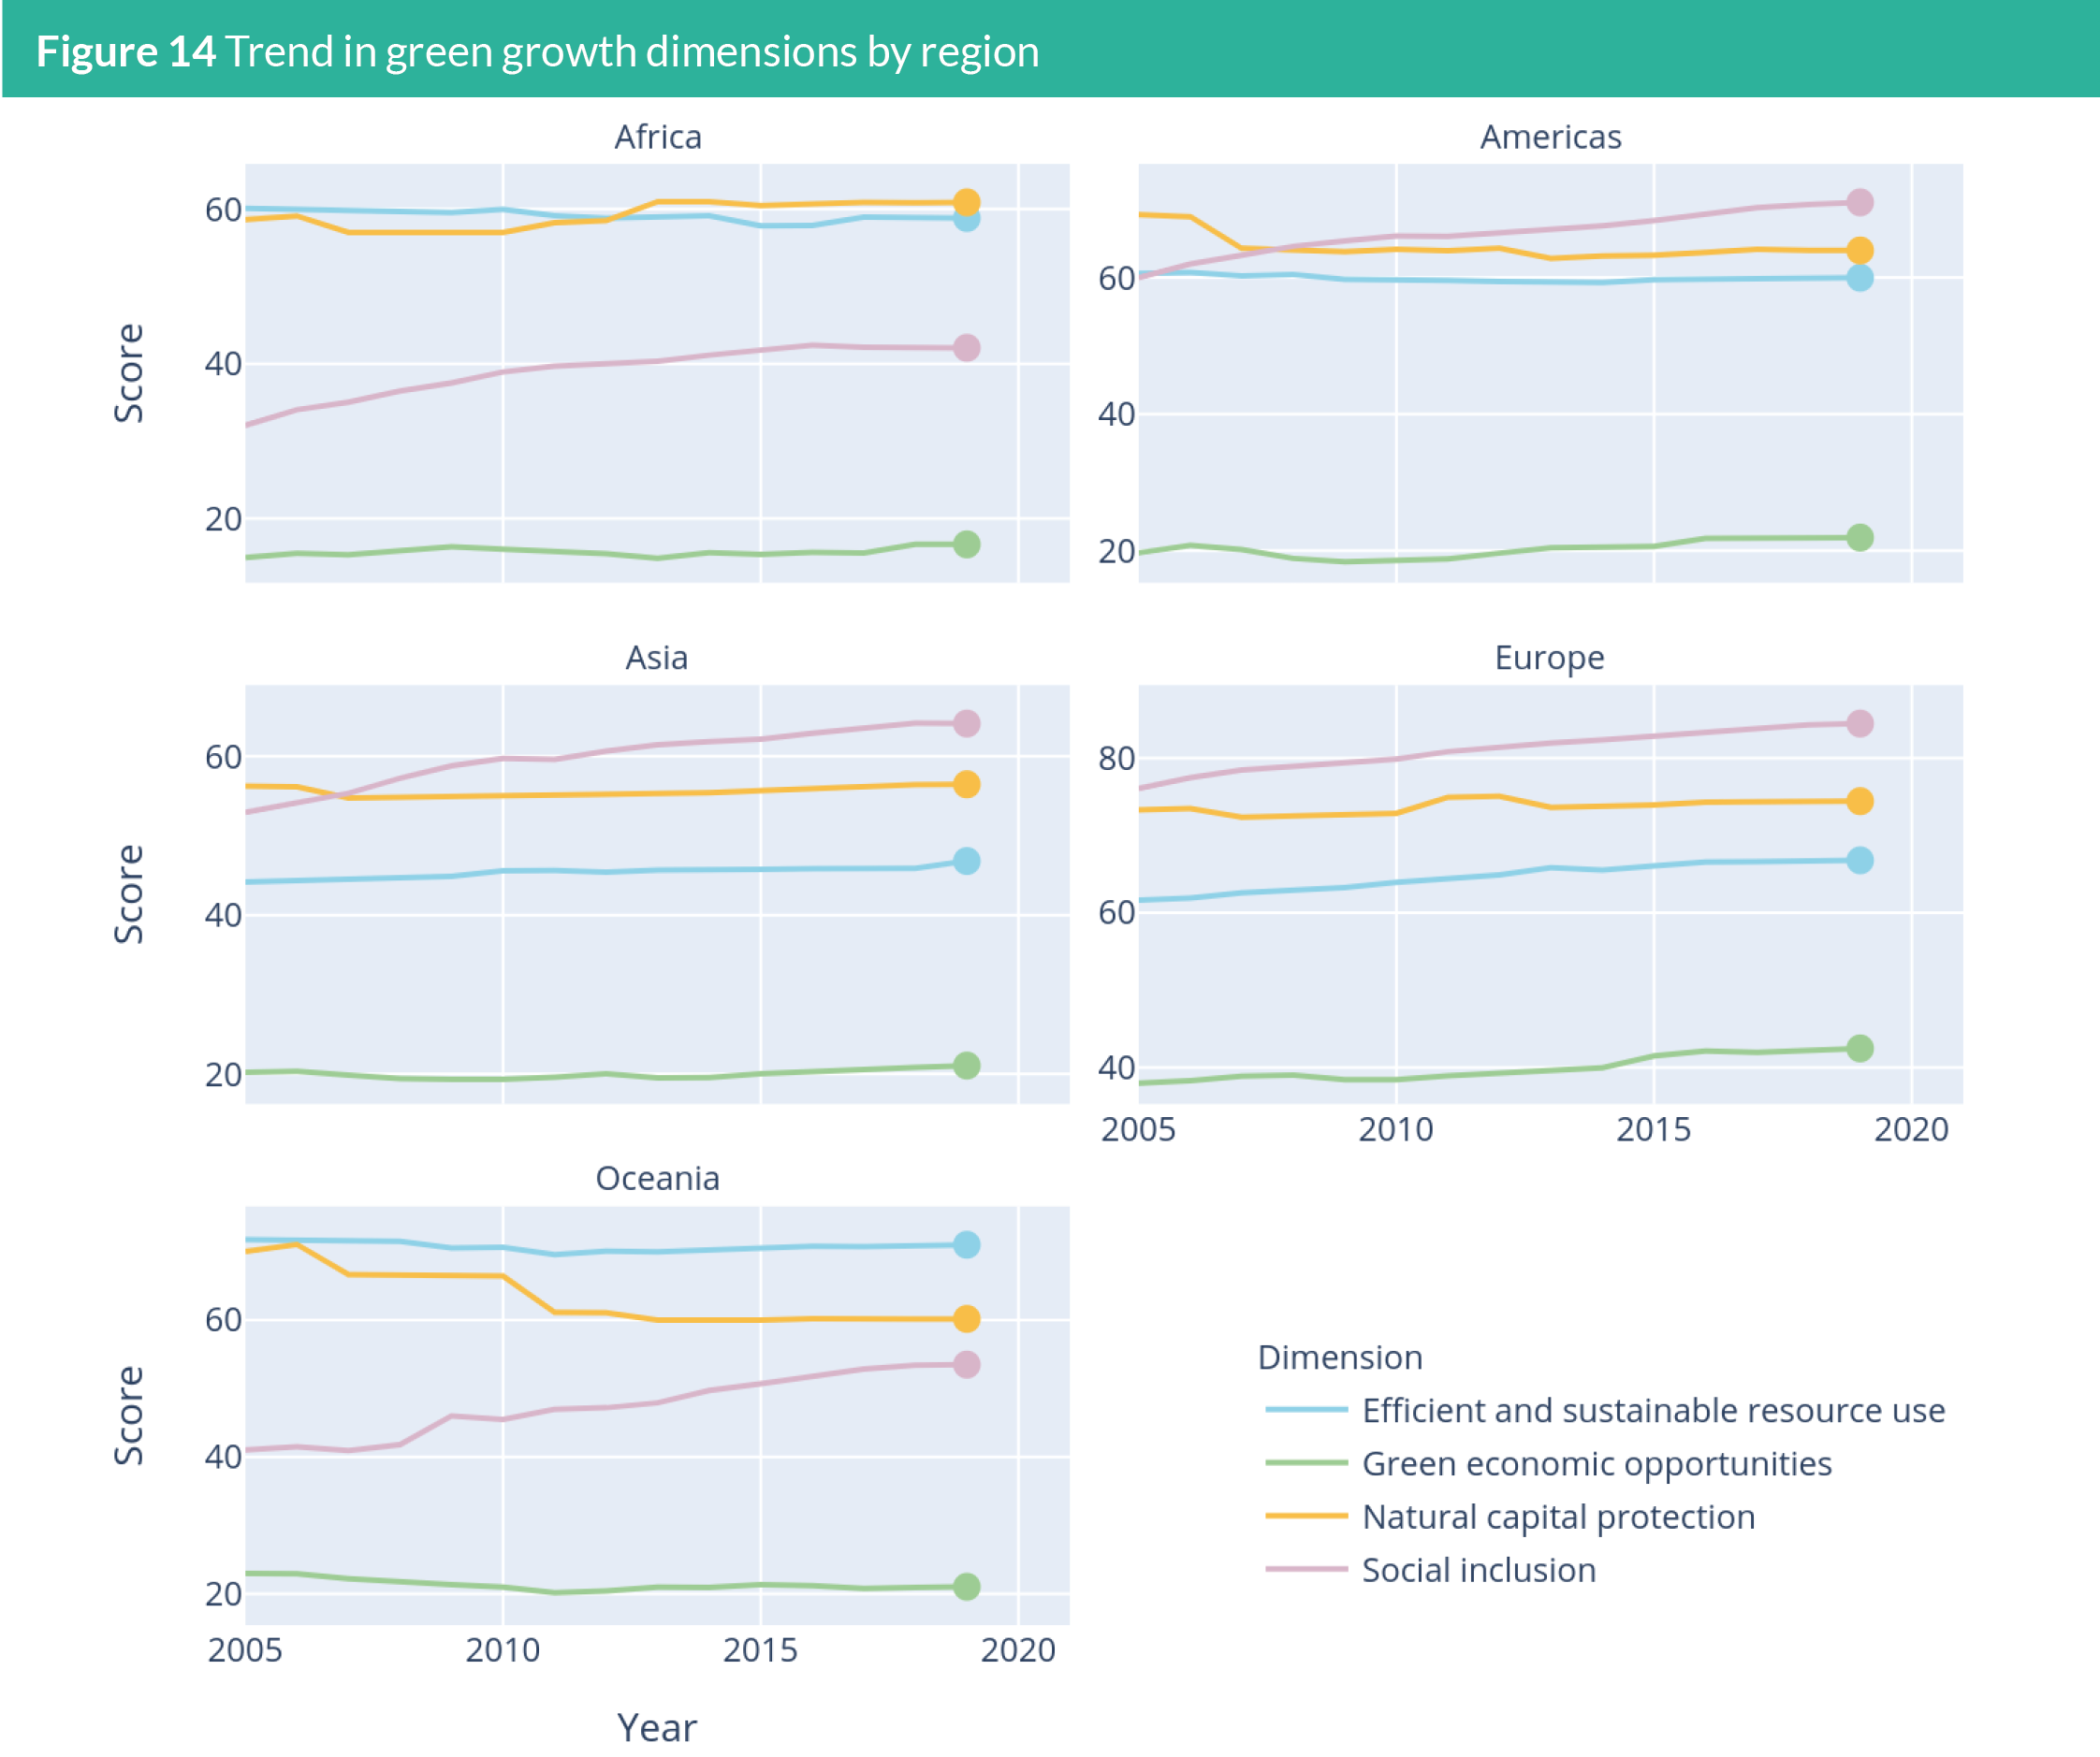
From the disaggregated trends observed in Figure 14, some
general conclusions can be drawn. Although the trends differ across
continents for other dimensions, green economic opportunities is
consistently below targets and largely stable across time, except
in Europe where the trend is rising slightly and greater than other
regions. Another positive trend to note is that across all continents,
social inclusion scores have risen systematically over the past
15 years. This is especially true in areas with many developing
countries like Asia and Africa. The increase in social inclusion scores
can largely be attributed to the wide-ranging efforts at poverty
reduction including the inflow of foreign aid, government welfare
programs, and efforts by international organizations including the
UN (Ravallion, 2020).
Certain interesting comparative trends can also be noted (Figure
14). For instance, African nations are on par with European countries
in the efficient and sustainable resource use dimension. This seems
to be at least partly due to the indicator on the ratio of total primary energy supply to GDP, where many African nations have a score of
100, indicating that they have reached or exceeded the sustainability
target. The high scores for this indicator are due to the lower total
consumption of energy in many African nations like Burkina Faso
and Ethiopia as well as the increasing investments in renewable
energy. Moreover, this trend may continue in the future as the
continent has many renewable energy resources to exploit, including
geothermal and solar energy (IEA, 2019). It can also be observed
that Africa scores slightly better on the dimension of natural capital
protection than its richer counterpart, Asia. This is because the
Asian developing countries have usually prioritized industrialization
over conservation, while Africa has only produced 2% of energyrelated
global carbon-dioxide. This can be expected to change in the
coming years as African nations also emerge on a path of industrial
development.
The following parts of this chapter provide explanations for the
above-mentioned trends in the green growth dimensions.
Africa
Africa has a sustained increase in the social inclusion dimension
score, which can be attributed to a variety of factors including
the many initiatives to improve education and healthcare and
reduce poverty. Some of these include conditional cash transfer
schemes implemented in many countries, the popularity of mobile
money, and malaria prevention initiatives like the distribution of
insecticide-treated bednets. About 450 million malaria deaths were
prevented in sub-Saharan Africa between 2000 and 2015 due to
the distribution of such nets (WHO, 2015), which has contributed
to the rise in the healthcare indicator. The effect of mobile money
schemes can be seen most prominently in the case of Kenya, where
the indicator on fixed internet broadband and mobile cellular
subscriptions has increased rapidly over the past decade. Further,
some studies found that mobile money initiatives in Kenya also
empowered women which were observable in the gender balance
indicators , especially on the account at a financial institution or
mobile-money-service provider. Even low-income nations such as
Somalia and Mali have recorded rapid increases in the score for fixed
internet broadband and mobile cellular subscriptions. Botswana, which is another country that has prioritized inclusive development
in the past years, has also recorded an increase in the social inclusion
indicators, particularly in access to basic services and resources.
The efficient and sustainable resource use dimension has remained
largely consistent across time since efforts for introducing clean
energy have been largely countered by a drive for industrialization.
While many African countries have scores near 100 for the
indicators on material footprint per capita, soil nutrient budget, and
share of freshwater withdrawal, their scores on other indicators
like share of organic agriculture are below 20 for most countries.
In the natural capital protection dimension, a similar narrative
emerges since efforts to conserve biodiversity and forest land
have been resisted by politicians and interest groups who wish to
exploit these resources. While most nations score highly in certain
categories like in forest area to total land area and municipal solid
waste generation, there are mixed results in other categories. For
instance, in the indicator for Disability-Adjusted Life Year (DALY)
rate due to unsafe water sources, countries such as Niger, Chad,
and the Central African Republic have consistently scored very low
(below 20). In the green economic opportunities dimension, trends are difficult to ascertain in many cases because there were only a
few data available. Generally, African countries perform uniformly
low on most indicators, with some nations like Tunisia and Morocco
outperforming others. The best performance is in the indicator on
adjusted net savings, where many countries score above 70.
Americas
In the Americas, the social inclusion dimension has seen a steady
rise over time, although the developed countries like Canada and
the United States outperform other nations substantially. The rise
in social inclusion can be largely attributed to South and Central
America’s investment in social welfare, like the Bolsa Familia
program in Brazil and Oportunidades in Mexico (Cecchini, 2020).
These two countries have seen a rapid rise in access to basic services,
social protection, and gender balance indicators and a moderate rise
in social equality scores. On the other hand, there has been a slight
decline in the natural capital protection dimension, primarily due to
score decreases in cultural and social value indicators in many of the
Caribbean countries like Antigua, Barbuda, Barbados, the Bahamas,
and Aruba.
In efficient and sustainable resource use, trends in the Americas
have remained largely stable, as the adoption of renewable energy
has been slow, even in places like the United States and Canada.
All countries perform poorly in indicator on water use efficiency,
with scores below 20. In indicator on material use efficiency, the
Americas perform relatively well, with most countries having high
scores above 80. While the score for soil nutrient budget is near 100
for most countries, the indicator on share of organic agriculture is
very low and remains persistent across time. The trends for green
economic opportunities are more mixed differing from country to
country and on average remaining unchanged over time. Canada
has seen a rise in indicator values for green employment and share
of patent publications in environmental technology. On the other
hand, the indicator on adjusted net savings has a decreasing score
for many countries, although it remains the highest scored category
in this dimension (as also the case in Asia and Africa). The share of
export of environmental goods to total export is the indicator in
which most countries score consistently below 20.
Asia
Asia has also recorded increasing trends in social inclusion and stable
trends across other dimensions. The rise in social inclusion has been
driven by an increase in access to basic services and social protection
categories, as well as modest improvements in gender balance
indicators across most countries. This is because large investments
have been made since the beginning of the 21st century in welfare
programs, with the aim of reducing absolute poverty. Some examples
are sanitation and healthcare programs in Bangladesh and Sri
Lanka, workfare programs in India, and the popularity of cash
transfer programs throughout many developing countries (Berg,
Bhattacharyya, Rajasekhar, & Manjula, 2018; UNICEF & WHO,
2019).
In the dimension of natural capital protection, Asian countries have
not seen an increasing trend towards the sustainability target.
This is primarily due to a large failure in curbing air pollution. India
and China have cities that frequently appear in the top lists of the
most polluted nations. Similarly, cities in Bangladesh, Pakistan, and
Mongolia often have dangerous levels of particulate matter (PM)
2.5 levels (UNEP, 2019). In other natural capital indicators including the biodiversity indicators, DALY rate due to unsafe water sources,
and tourism in marine and coastal areas, there are mixed results with
most countries recording stable trends across time. In the efficient
and sustainable resource use dimension, Asia has failed to improve
substantially over the past 15 years, despite large investments in
renewable energy by both India and China. The region’s score is
uniformly poor in the category of water use efficiency, with many
countries scoring between 1 and 10 points. Generally, as with Africa,
Asian countries have not seen an improvement in performance
along the dimension of green economic opportunities and the best
performing category in this dimension is the indicator on adjusted
net savings.
Europe
Europe has recorded an increasing trend across the dimensions
of efficient and sustainable resource use, green economic
opportunities, and social inclusion, which is a positive sign for green
growth transition. Countries such as Germany and the Scandinavian
nations of Denmark, Norway, Sweden, and Finland have encouraged
investments in renewable energy due to which the indicator on
efficient and sustainable energy has seen a rise. Although many
European nations have enacted strict air pollution laws by using
low emissions zones and congestion charging policies (OECD, IEA,
ITF, & NEA, 2015), the air pollution indicator (PM2.5) has seen a fall
from target levels since 2005. Due to this and only stable trend in
biodiversity indicators, the natural capital dimension in Europe has
not substantially changed over time. In the case of social inclusion,
the increased score can be attributed to improvements across all
indicator categories in many of the Eastern European nations like
Bulgaria, Slovakia, and the Czech Republic. Additionally, gender
balance indicators across most countries have been very close to
target levels since the enactment of policies for equality, such as
mandating equal pay and treatment of women in the workplace
(EIGE, 2020). The green economic opportunities dimension has
also seen an upward trend due to consistent importance given to
the creation of green employment and the focus on sustainable
innovations (Pociovălişteanu, Novo-Corti, Aceleanu, Şerban, &
Grecu, 2015).
Oceania
Oceania shows interesting trends across time, with a steep drop in
natural capital protection and a rise in social inclusion. The drop in
the natural capital protection score is due to a significant decrease in
the environmental quality indicators in New Zealand and Australia.
Cultural and social value indicators have also dropped for places like
Fiji, the Marshall Islands, and Vanuatu. The rise in social inclusion can
be attributed to an increase in access to basic services and resources
across all countries, as well as a moderate increase in scores for the
gender balance category. With respect to efficient and sustainable
resource use, information for water-use efficiency remains limited,
but performance in other categories has been consistent with a
slight increase for most countries in efficient energy use.
Data remains sparse in the dimension of green economic
opportunities but indicates that both Australia and New Zealand
have had declining scores in share of export of environmental
goods to total export and share of green employment in total
manufacturing employment. Fiji has shown a steep increase in green
employment with a score of 85.34 in 2020 (up from 51.6 in 2005),
due to an increase in jobs at tourism resorts and jobs which are
energy and water efficient and sustainable (GGGI, 2019).