2.2 Dashboards
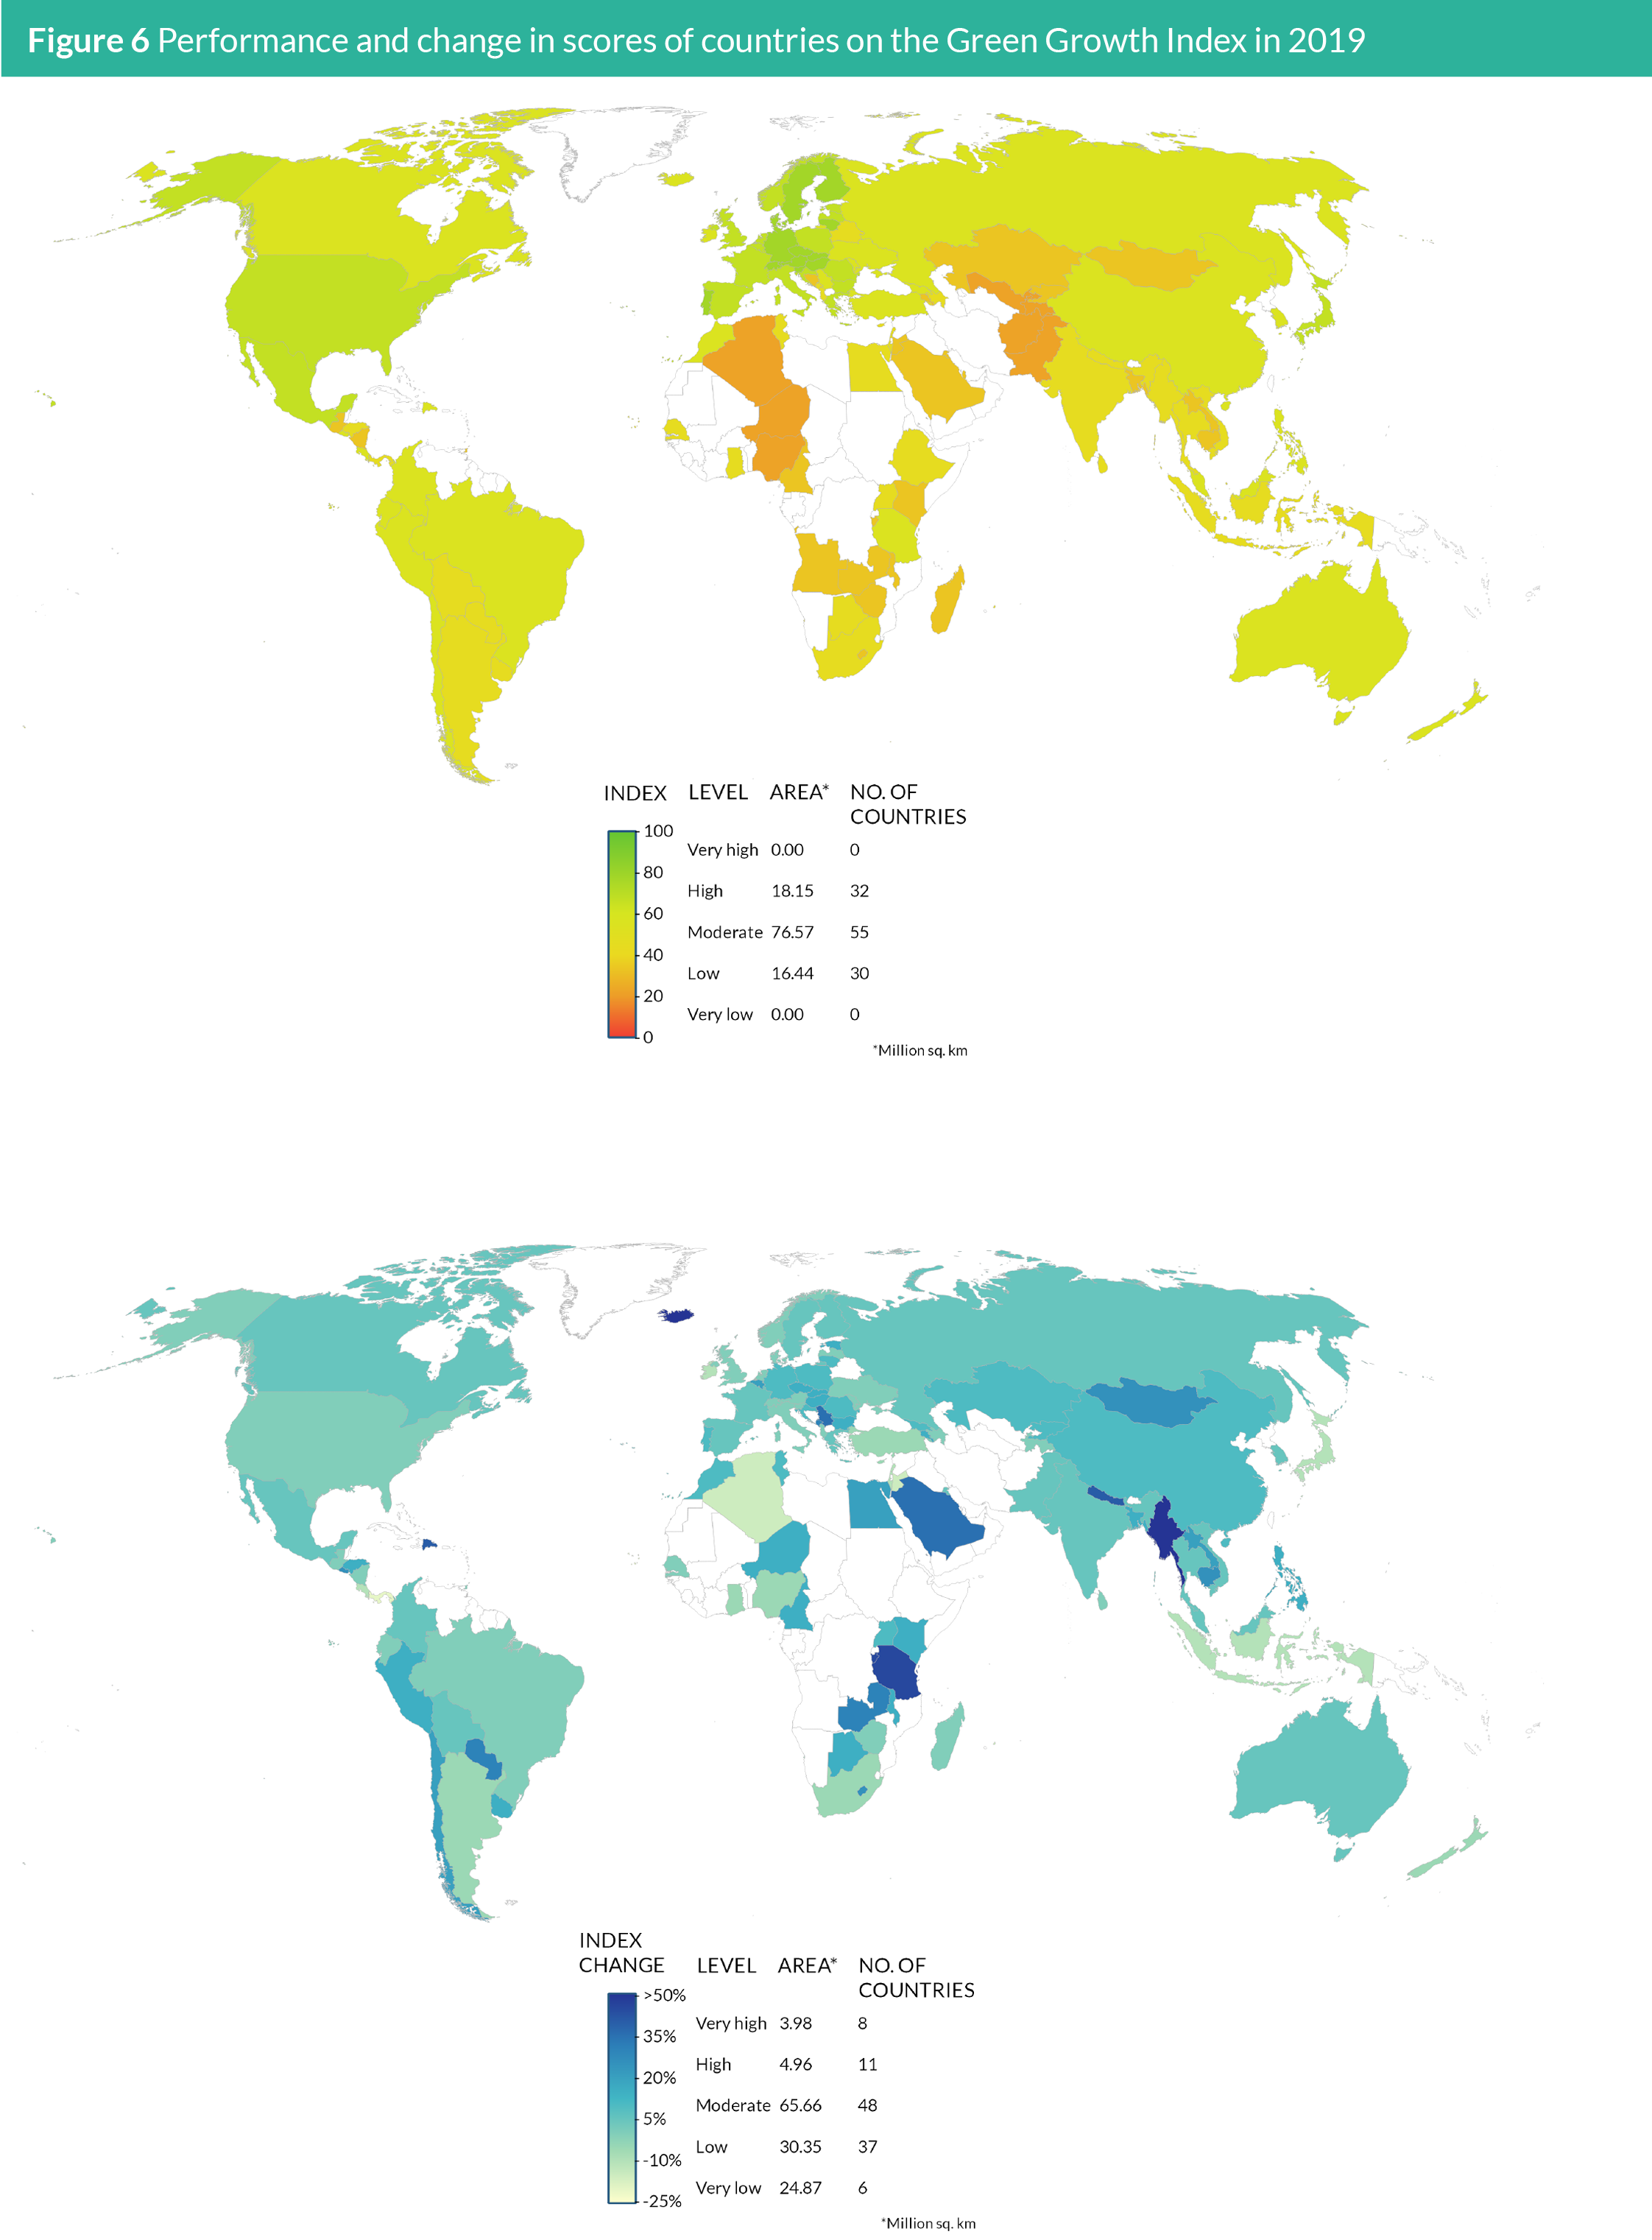
Table 2 presents the country dashboard for the Green Growth Index
by region and compares the changes in the scores of the Index from
2005 and 2019. In 2019, the top performing countries by region
were Tanzania in Africa, Mexico in the Americas, Japan in Asia,
Sweden in Europe, and New Zealand in Oceania, while the least
performing countries were Niger in Africa, Trinidad and Tobago in
the Americas, Uzbekistan in Asia, Malta in Europe, and Australia in
Oceania. There were, however, only two countries with scores for
the Index in Oceania due to lack of data for many countries in this
region. Moreover, the score for Australia represents the scores in
the upper range among the countries in the Americas and Asia. In
Table 2, multi-directional arrows are used to show the performance
of countries over time:
• ![]() pointing straight up represents increasing performance,
pointing straight up represents increasing performance,
above 10% increase in scores
• ![]() slightly slanting upward represents modest
slightly slanting upward represents modest
performance, between <10% and >=1% increase in scores
• ![]() horizontal represents stable or almost no change in
horizontal represents stable or almost no change in
performance, between <1 and >=0% change in scores
• ![]() slightly slanting downward represents slight decline in
slightly slanting downward represents slight decline in
performance, between <0% and >= -10% decline in scores
• ![]() pointing straight down represents worsening
pointing straight down represents worsening
performance, below -10% decrease in scores
A 10% interval was used to measure the performance because
the data points gather around this value. Although, Africa had the
lowest scores among the regions, many countries showed increasing
performance from 2005 to 2019. Tanzania, for example, experienced
a 48% increase in scores for the Green Growth Index, one of the
eight countries with the highest percentage change of above 35%
globally (Figure 5). But Table 2 also shows that Africa has the
greatest number of countries displaying a worsening performance
with a decrease in scores of over -10%. Nonetheless, Africa has more
countries showing an increasing performance than in the Americas
and is par with other regions in terms of the number of countries
with this good level of performance. Moreover, the other top
performing countries in other regions have performed lower than
Tanzania, which is the top performing country in Africa. On the one
hand, Mexico and Sweden only experienced modest performance
over this period, while Japan and New Zealand showed a slight
decline in performance. The best performing country worldwide
with 89% change in Index score from 2005 and 2019 is Iceland, but
this level of change can be considered an outlier as the rest of the
countries have percentage change of below 50%.
The better performance in Europe compared to other regions
can be attributed to the relatively high scores for green economic
opportunities in many European countries (Table 2). Only few
European countries like Belarus, Albania, Montenegro, Bosnia and
Herzegovina, and Malta showed very low scores for this green
growth dimension. Among these countries, only Montenegro
showed an increasing performance over time. In contrast, more than
half of the countries in Africa, the Americas, and Asia have scores
below 20 for green economic opportunities. In Asia, more advanced
countries like South Korea, China, and Japan are taking the lead
in creating green economic opportunities. In Africa, these include
developing countries like Tanzania, Tunisia, Egypt, and South Africa.
If appropriate amounts of green investments and innovation would
be made to enhance green employment and trade, many developing
countries in the Asian and African regions would be expected to
experience increasing performance in the future. In the Americas,
performance of creating green economic opportunities in the
United States and Canada are not on par with their peer developed
countries in Europe.
The sub-regional performance for the different indicators is
presented in Figure 7. It shows that the scores for the three
among the four indicators for green economic opportunities are
predominantly low and very low. On average, the scores for green
trade (GT) are also low for all subregions in Europe. The scores for
green investment (GV) are moderate for most sub-regions. After
green economic opportunities, scores for efficient and sustainable
resource use indicators are least impressive for most sub-regions,
except for material use efficiency (ME). While efficient and
sustainable use of energy (EE), water (EW), and land (SL) have low
and moderate scores, the latter indicator shows scores from high to
very high.
For the indicators of natural capital protection, the scores for
environmental quality (EQ) and GHG emissions reduction (GE)
also range from high to very high with few exceptions. For example,
Northern America as well as Australia and New Zealand have scores
of only around 40 for the reduction of emissions. In contrast, scores
for indicators on biodiversity and ecosystem protection (BE) and
cultural and social value (CV) are lower than the other two previous
indicators in most subregions. In the case of the former indicator,
subregions like Northern Africa, Central Asia, Western Asia, and
Polynesia have very low scores for the protection of biodiversity
and ecosystem. Scores are mostly low and moderate for cultural and
social value (CV) with the exceptions of Europe as well as Australia
and New Zealand wherein these sub-regions, scores are either high
or very high.
For social inclusion, the scores are rather divergent for the different
indicators and across the subregions. Social equity (SE) indicator
has the highest number of subregions with high or very high scores,
except for most subregions in Africa. Social equity in Northern Africa
is on par with the rest of the subregions of the world. Except for
gender balance (GB) with high scores in Eastern and Southern Africa,
the scores for the rest of the indicators have mainly low cores. The
Eastern, Middle, and Southern sub-regions in Africa have low scores
for both access to basic services and resources (AB) and social
protection (SP). Although a bit better than Africa, many sub-regions
in Oceania have also low scores for social inclusion indicators, except
for social equity.