Green Growth Index:
Methodology
Design Process
- Introduction
- Global Review
- Regional Outlook
- Country Performance
- Expert Consultations
- Ongoing applications and collaborations
- Statistical Tables
- Appendix 1 Summary of methods for the Green Growth Index
- Appendix 2 The international expert group
- Appendix 3 List of expert reviewers
- Appendix 4 The GGPM Team
- Partners
From the beginning of developing the Green Growth Index in 2016,
GGGI has placed significant value on consultations with experts
from different fields and institutions from different parts of the
world for several reasons such as to increase policy relevance of
the green growth indicators, create awareness on the utility and
enhance uptake of the Index, and encourage collaboration on its
application. When the Index was first published in 2019, over 300
experts from about 40 countries have been consulted. Many of
these experts remained involved in the annual review of the Index,
but GGGI continues to invite more experts to make the review as
comprehensive and global as possible. This section discusses the
approach for and results of the expert review on the 2020 Green
Growth Index.
5.1 Online survey
5.1.1 Questionnaire design
The expert consultation was conducted through an online survey
from November 1 to December 30, 2020. The questionnaire was
semi-structured consisting of five parts (Appendix 2):
• Involvement in the review – whether experts have participated in
the previous reviews
• Personal information – name, gender, organization, and country
• Work qualification – field of expertise, relevance of work to
indicators or composite index as well as to green growth
• Expert opinion on the new indicators – GE1, BE3, GB2, SE1, SP2,
and GN1; SL1 was not included but mentioned in the questionnaire
because the new indicator was not yet available during the survey;
GE2 and GE3 were not included because the updates only refer to
other units of measurement; and SE2 was not included because the
changes dealt with the availability of the time-series data, which
cannot be influenced by the experts
• Method for aggregating indicators – options for aggregation
method to increase the number of countries with scores for green
economic opportunities, which is the dimension with not only the
least number of indicators but also with lowest country coverage
due to data availability
5.1.2 Response rate
Table 3 presents a summary of the response rates to the online
survey by a group of experts. The overall response rate is 54%, with
the expert group and scientists accounting for the highest response
rate within the types (80%) and over the total number (31%) of
experts, respectively. The scientists who were invited to participate
in the review are mainly those currently engaged in the Task Forces
on scenarios and models, knowledge and data, and policy tools of the
IPBES and authors in the Working Group II of the Sixth Assessment
Report of the IPCC. The low response rate among scientists can be
attributed to their very busy schedule in their respective tasks for
these task forces and working groups. In the case of policymakers,
the invitees are mainly those who participated in the four regional
workshops in 2018. The reasons for the low response rate among
them are either due to their busy schedules or retirement from
their offices. With the expectation that many experts would be
unable to participate, the number of invites for the online survey had
been significantly increased this year, resulting to 110 completed
questionnaires (as compared to 90 last year). However, there are
only a few participants from the NGOs this year. Thus, the number of
experts to be invited from NGOs and private sector will be increased
in the next surveys to enhance participation from this group.
5.1.3 Respondents’ characteristics
Table 4 describes the characteristics of the experts from the
different organizations who participated in the review. The
majority of the experts come from international organizations
and academic/research organizations with a combined share to a
total number of experts of about 66%. While gender balance was
taken into account when sending invites for the online survey, the
response rate was higher among male experts, particularly from
international organizations and NGOs. The gender ratio was highest
among the experts from academic/research organizations at 0.95,
where relatively more female experts participated in the review as
compared to other organizations. More than half of the experts also
participated in the review of the 2019 Green Growth Index, with
the highest percentage coming from the government organizations.
The experts who participated for the first time in the review this
year come from academic/research organizations. Although only
69% of the experts work on indicators and composite indices, a high
percentage of them (85%) are working on issues related to green
growth. Surprisingly, only 62% percent of the academic/research experts indicated that their work is related to green growth even
though all of them are supporting IPBES and IPCC initiatives, which
are both relevant to the green growth dimensions on efficient
and sustainable resource use and natural capital protection. This
implies that, while most experts from international organizations,
governments, and NGOs are very knowledgeable about the green
model of growth, those from the academe are not.
5.2 Expert feedback
5.2.1 New green growth indicators
Figure 18 presents the responses of the experts to the questions
related to the new green growth indicators. Over 80% of the
experts agreed to include the new indicators for GE1: Ratio of
CO2 emissions including Agriculture, Forestry and Other Land
Use (AFOLU) to population and GB2: Share of adults (15 years and
older) with an account at a financial institution or mobile-moneyservice
provider. Experts’ responses to the inclusion of GN1: Share
of patent publications in environmental technology to total patents
(cumulative) and SP2: Universal health coverage (UHC) service
coverage index as new green growth indicators were also mainly
positive, with about 70% of them responding “Yes” to the question.
The positive responses for the inclusion of BE3: Above-ground
biomass stock in forest and SE1: Inequality in income based on Palma
ratio were the lowest, albeit still above 50%. But the main reason for
disagreeing for their inclusion is the lack of expertise among over
30% of the experts, thus responding “I do not know to the question”.
Only about 17% and 37% of the experts indicate that they have
expertise in social inclusion and social and gender equality, and
biodiversity and ecosystem, respectively.
5.2.2 Aggregation method
The last question posted to the reviewers in the survey is their
consensus to change the method to aggregate the four indicators
for the green economic opportunities. In 2019, the overall scores for
Green Growth Index were computed only for 116 countries because
many countries (particularly in Africa and the Middle East) lack data
for these indicators. As with the other green growth dimensions,
the scores for the green economic opportunities dimension were
only computed for countries with three or four indicators. But unlike
other dimensions, many countries had only two green economic
opportunities indicators and thus the country scores for this
dimension were not computed. Because the green growth concept
assumes that the four dimensions are equally important, no score on
Green Growth Index was computed for countries which lack green
economic opportunities scores. But several countries expressed
their interest to have scores for Green Growth Index and know
their ranks relative to their peer countries in 2020. In view of this,
two options were proposed for the computation of green economic
opportunities scores for countries with only two indicators for this
dimension.
• Option 1 for new method: Identify two indicators with the
highest scores and compute the geometric mean of these
two indicators (i.e., Other indicators with the lowest scores
are excluded)
• Option 2 for new method: Compute geometric mean if at
least two indicators have scores (i.e., Only the countries with
one indicator will be excluded)
• Previous method: Compute geometric mean only for
countries having at least three indicators with scores (i.e.,
Countries with only one or two indicators were excluded)
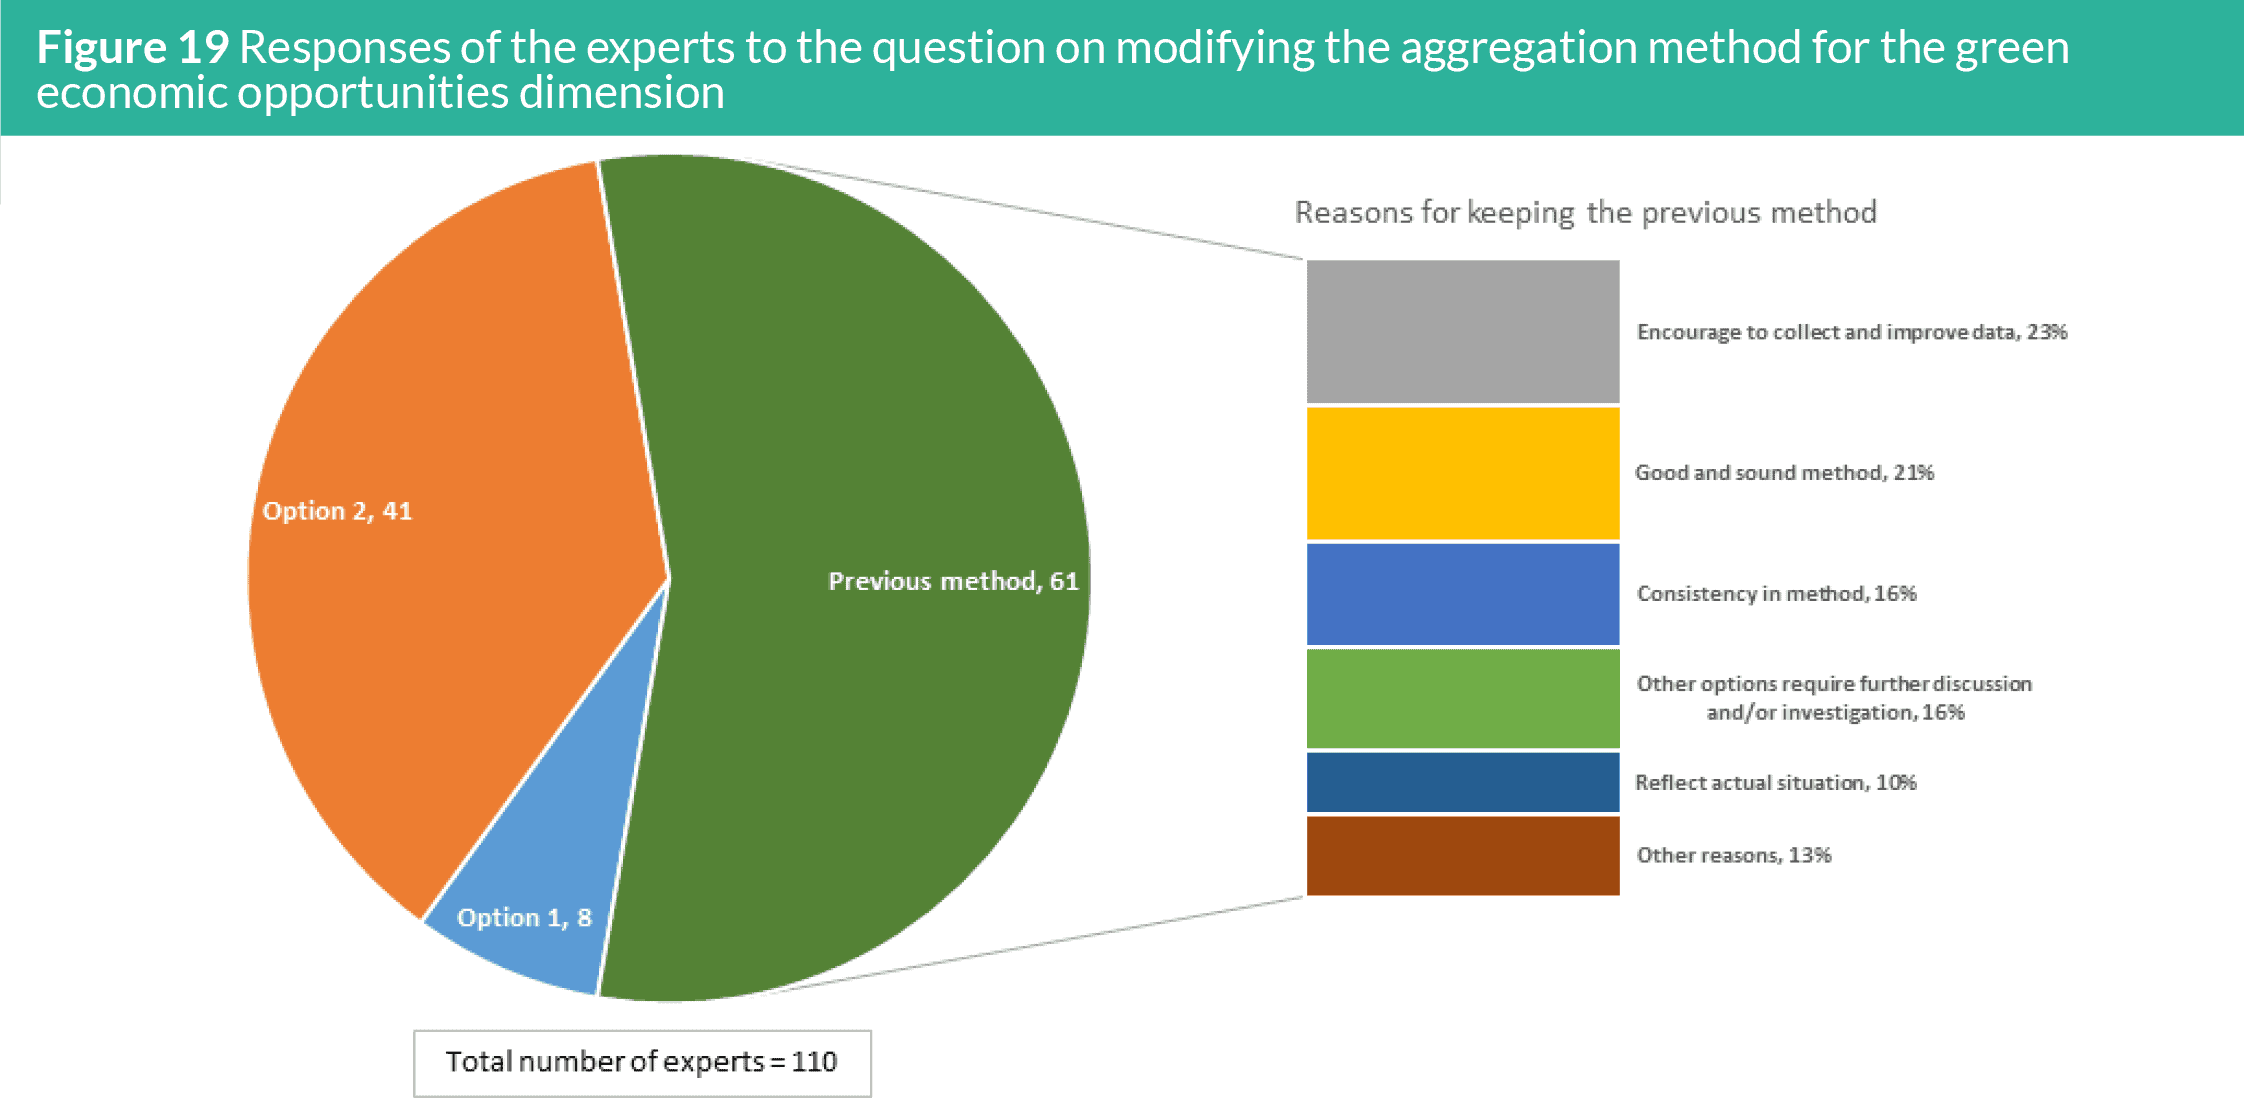
Figure 19 presents the responses of the experts to the question
on the aggregation method. More than half of the 110 experts did
not agree on the two options and suggested to continue to use
the previous method. The most important reason for this is the
need to encourage the countries to collect and improve their data,
with several experts suggesting that GGGI should play a key role
in supporting the countries on this. Many experts also suggested
keeping the previous method to keep the consistency, as this method
is already good and sound.
5.3 Next steps forward
5.3.1 Indicators and proxy variables
Although a significant improvement has been made in the 2020
Green Growth Index by updating 10 green growth indicators,
further improvements still lie ahead. As shown in Table 5, many of the
challenges identified from the previous report still remain, including
limited time-series data for indicators on the share of freshwater
withdrawal to available freshwater resources (EW2), share of
organic agriculture to total agricultural land area (SL2), municipal
solid waste (MSW) generation per capita (EQ3), share of patent
publications in environmental technology to total patents (GN1),
share of youth (aged 15–24 years) not in education, employment,
or training (SE3), and proportion of population above statutory
pensionable age receiving a pension (SP1). Moreover, the 2020
Green Growth Index continues to lack additional indicators for
efficient and sustainable resource use as well as green economic
opportunities, which have implications on the weights of the
indicators across dimensions. For example, the dimension on green
economic opportunities with only four indicators is receiving
relatively higher weight as compared to natural capital protection
and social inclusion, each with 12 indicators. GGGI will thus continue
to review the indicators in the next years.
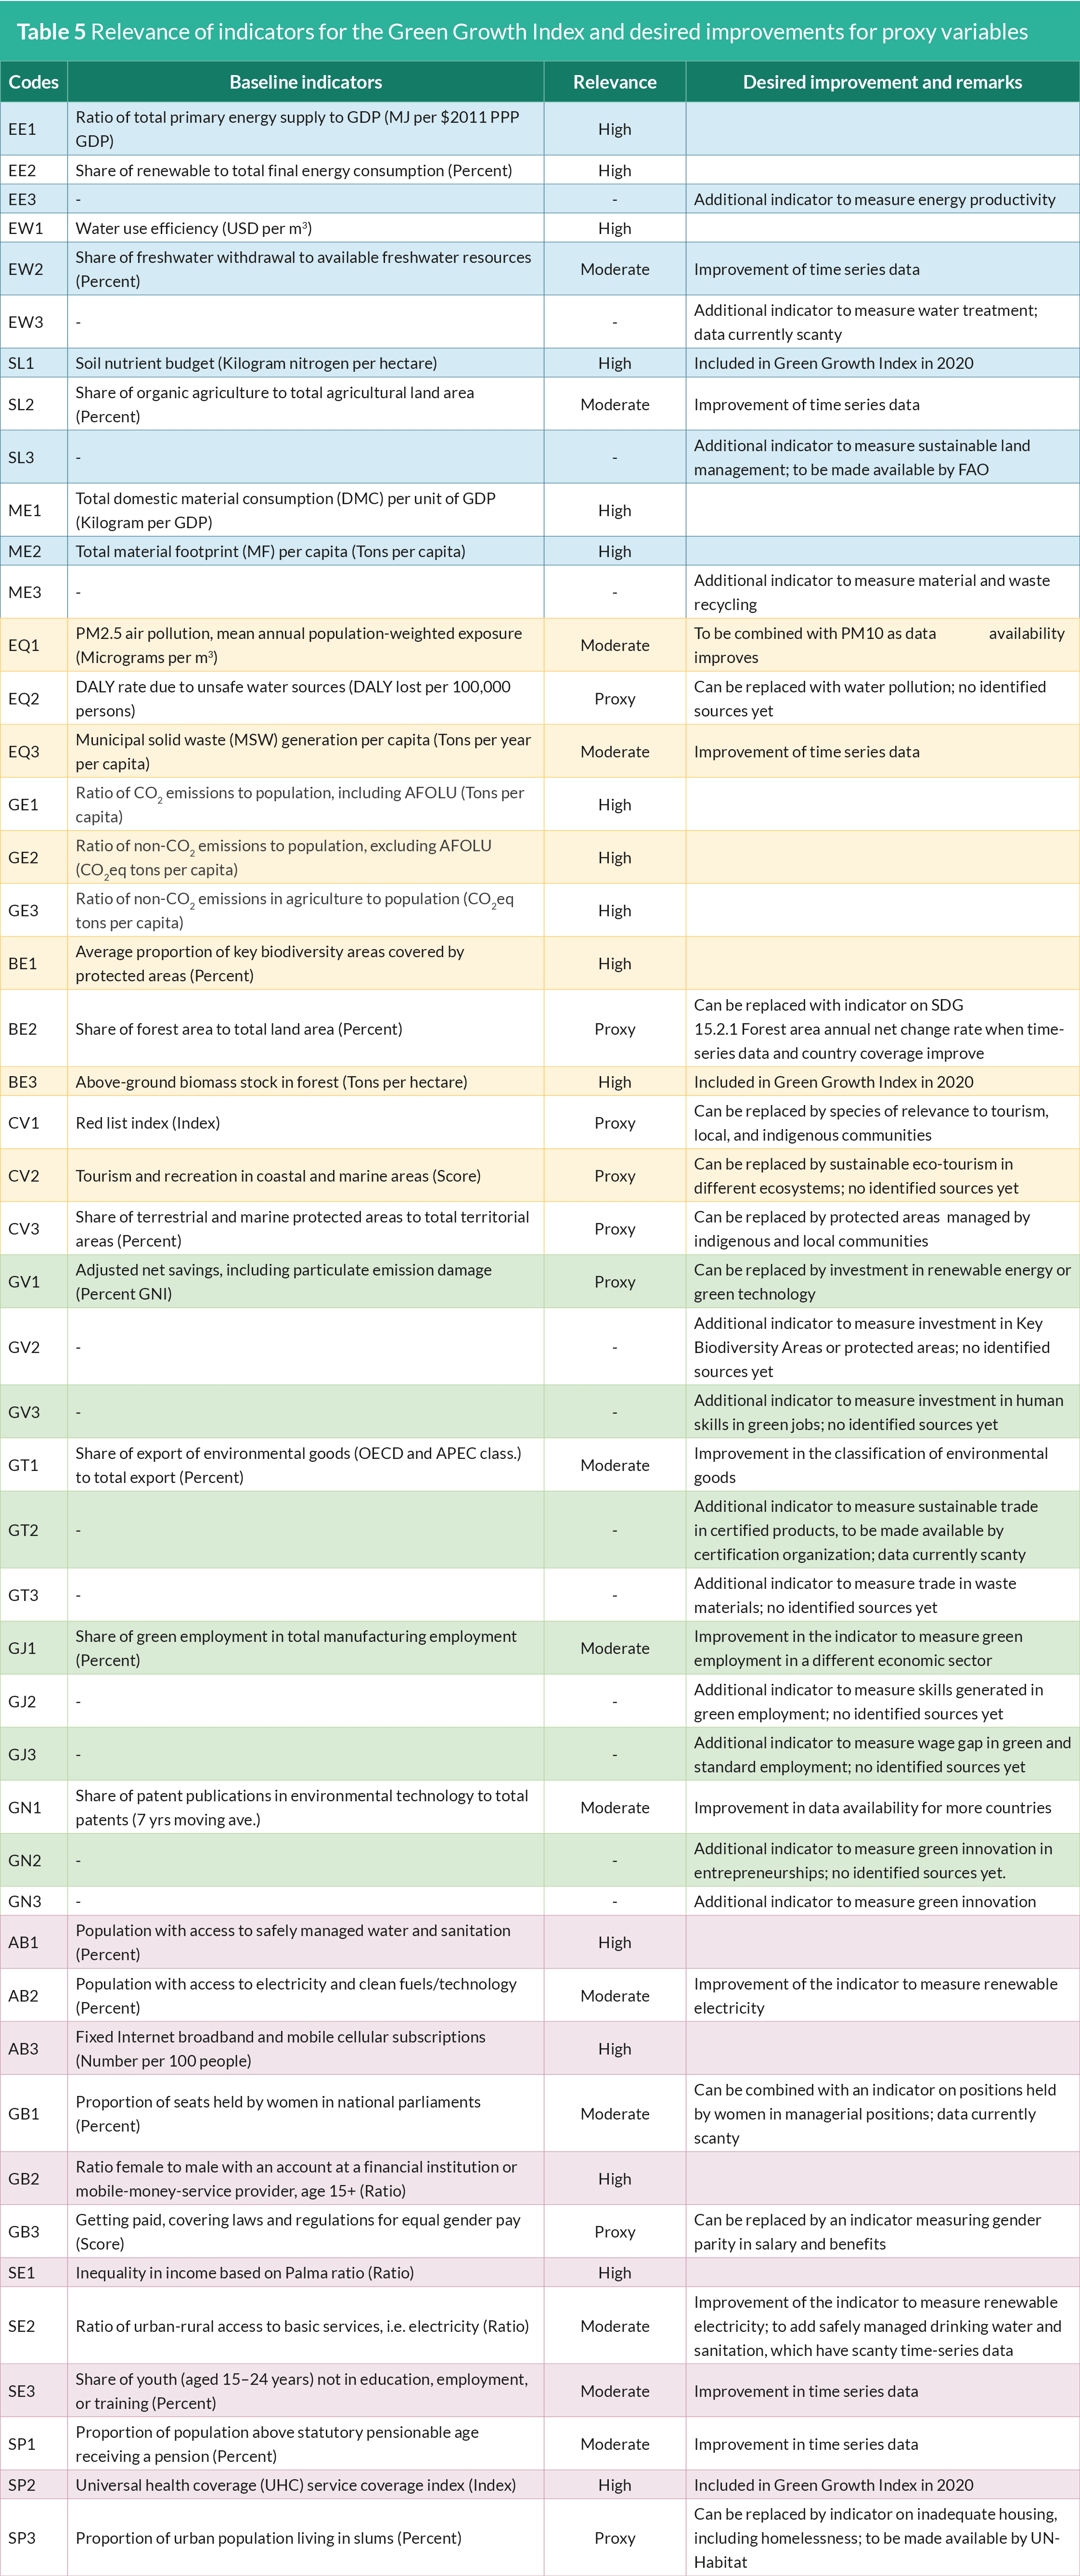
The collaboration with other international organizations could
provide a solution in developing additional indicators for green
economic opportunities. The Working Group on Metrics and
Indicators of the GGKP will soon publish a report on Measuring
Economic Opportunities with Policy Linkages: Employment,
Innovation, Trade and Investment, which will provide useful thematic
guidance for collaborative work. Another important challenge,
however, is identifying appropriate sustainability targets for not
only the additional indicators, but also for the existing indicators
which are not part of the SDGs or other international sustainability
goals. These include, among others, the four indicators for the
green economic opportunities. As mentioned in the previous
report, sustainability targets are critical information for the Green
Growth Index because they are used to benchmark green growth
performance. For indicators without available targets, mean values
of the top five performing countries are used in lieu of internationally
agreed sustainability targets. A drawback of this method is that it
allows countries to already reach the targets regardless of their
performance on a given indicator. One step that GGGI has been
taking on this was to request the producer or publisher of the
data to recommend targets for the indicator. This has been done,
for example, for the share of freshwater withdrawal to available
freshwater resources, and soil nutrient budget, cropland nutrient
flow per unit area, which were published by FAO.
5.3.2 Data availability and gaps
Although the GGPM team aimed to have a wide data coverage
in terms of the number of countries and years, some of the more
relevant indicators did not meet these criteria. For example, there
were only data for less than 100 countries on one indicator for green
economic opportunities, which is the share of patent publications
in environmental technology to total patents and two indicators
for social inclusion, namely the share of youth (aged 15-24 years)
not in education, employment, or training and the proportion of
urban population living in slums. No alternative proxy variables are
currently available for these indicators. The indicators for social
inclusion, however, are expected to improve in the coming years
because they are SDG indicators. There was data for only one
year for the municipal solid waste (MSW) generation per capita
(Table 6), but this is a proxy variable and expected to be replaced by
more desired data in the next few years. Data for all the indicators
included in the Green Growth Index are publicly available online,
except for the share of green employment in manufacturing to
total employment (GJ1). The data were mainly collected from
international organizations; this offers important advantages for
measuring performance across countries. For example, collecting
data from national agencies for more than 100 countries will be
cumbersome, whereas data from international organizations are
collected from national agencies and have already undergone
consistency checks. Nonetheless, during the regional consultation
workshops, some regional experts expressed concerns over using
data from international organizations (Acosta et al., 2019a). To
address these concerns, data for the indicators are published on
the Green Growth Index website to enable users to undertake
a consistency check of the data. Moreover, GGGI will help to
communicate any concerns on the correctness and validity of the
data to the international organizations that are responsible for
producing and publishing the data.
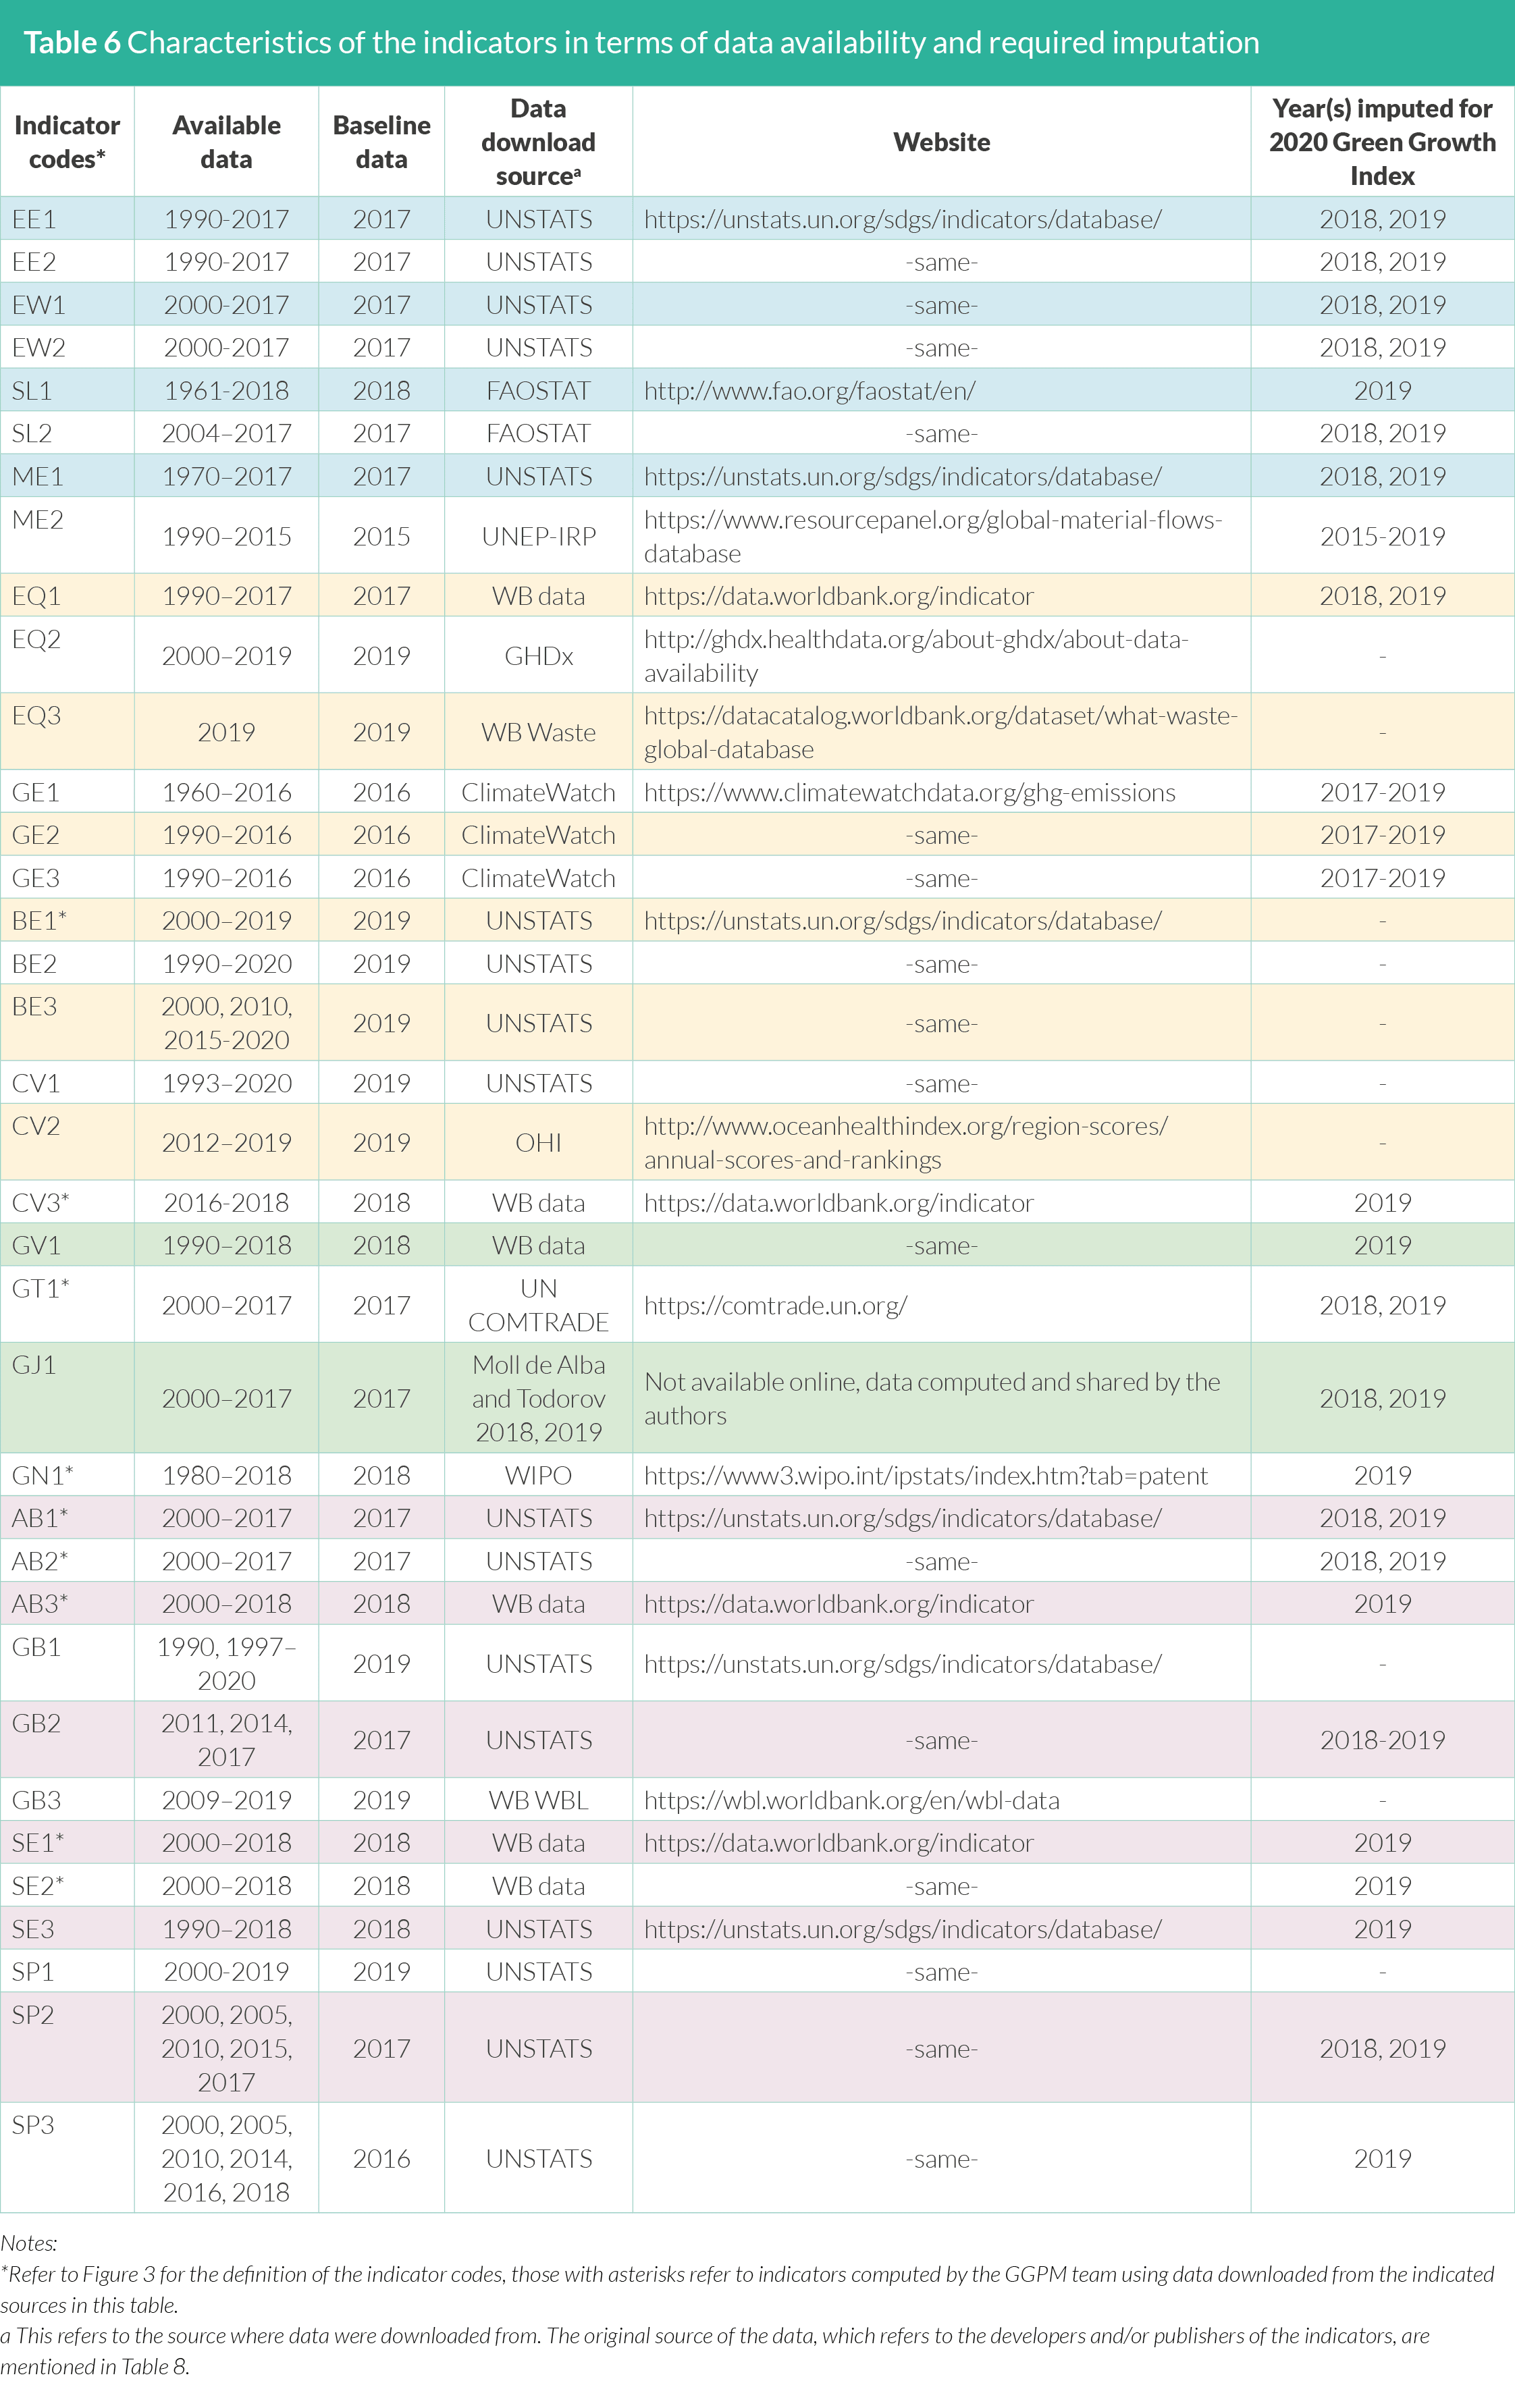
The most recent available data vary across indicators (Table 6). To
enable computation of the Green Growth Index for 2019, the most
recent data were used as baseline and values were assumed to hold
until 2019. For the missing data between the time-series from 2005,
the adjacent data were used to represent data for the missing years
(i.e. imputed data). On the other hand, the indicators with missing
data for several consecutive years were not imputed.
The availability of data is another important challenge that affects
the relevance of the indicators. The GGPM team considered the
indicators to be of high relevance for the framework if they are
not only conceptually relevant but also publicly available. The
completeness or lack of data influences the scores for the Green
Growth Index. For example, a country with complete data for
all indicators for green economic opportunities will have lower
scores if one of the four indicators has a value of zero, thus pulling
down the values of other indicators. In contrast, another country
with incomplete data will have a higher score because the fourth
indicator, which may also have a value of zero but missing and
unknown, will be excluded by default. The lack of data, thus, causes
some level of uncertainty in the results of the Green Growth Index.
Allowing missing values is, however, necessary for two reasons;
first is to allow substitutability of indicators that represent the same concept as represented by the indicator category and second
is to maintain a larger number of countries until the last level of
aggregation. Not allowing for substitutability at the first and second
levels of aggregation will exclude countries with missing values. Table
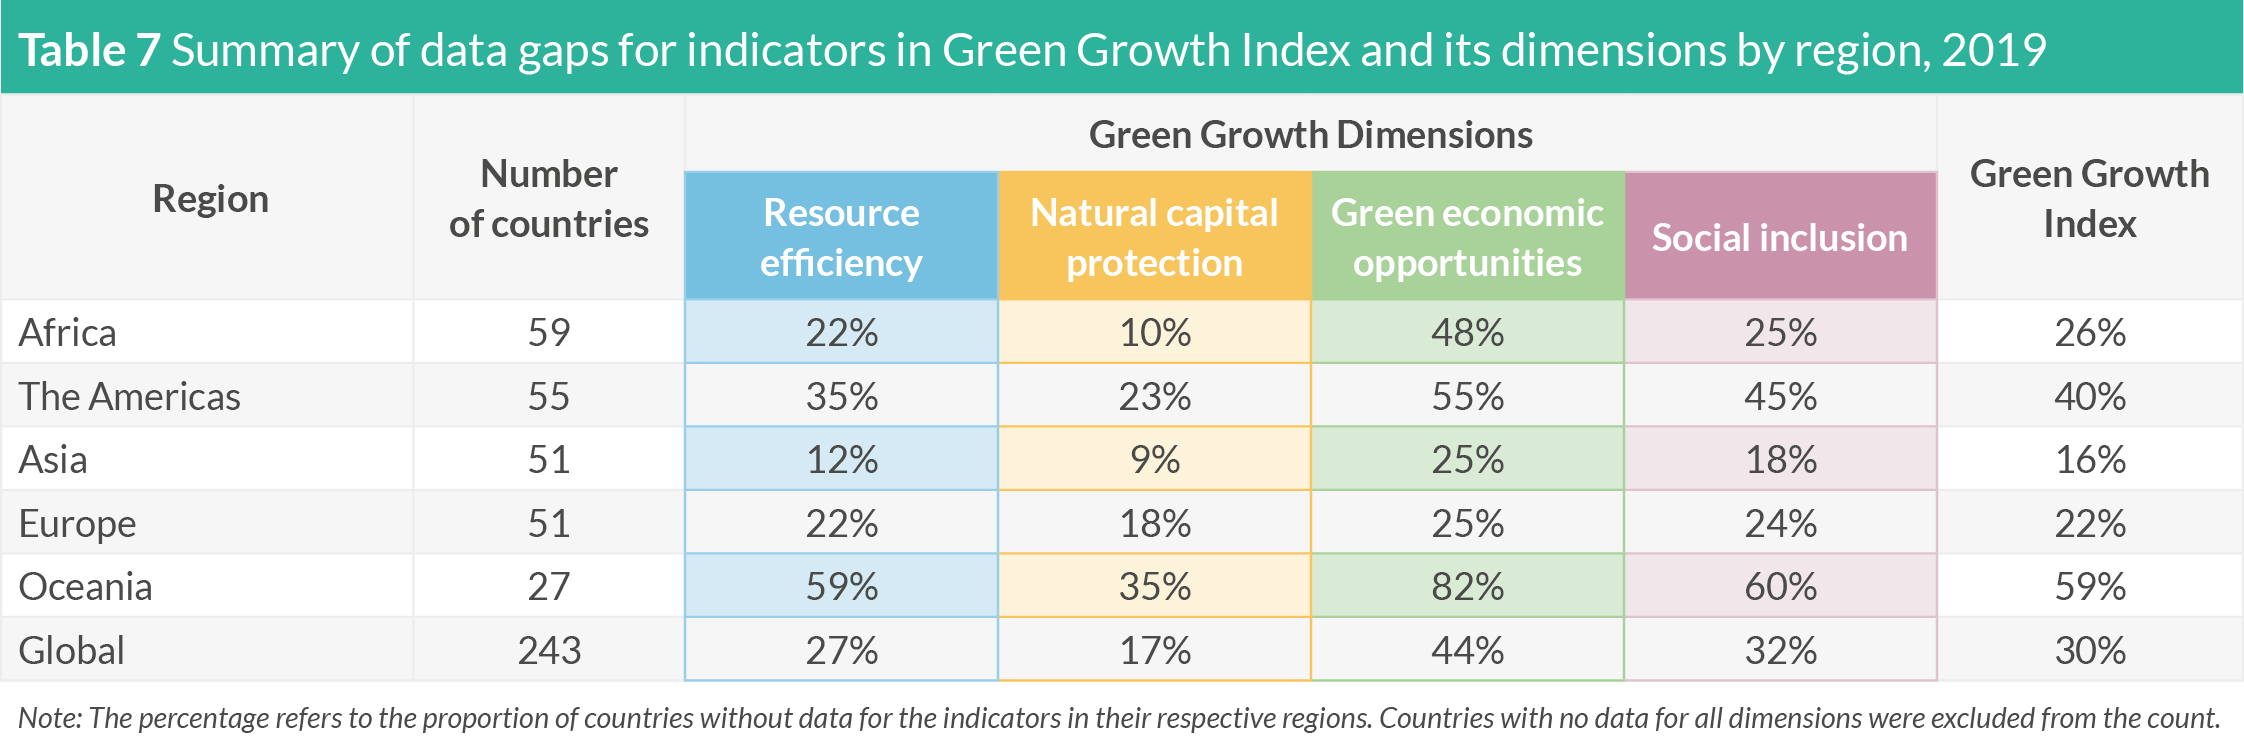
7 provides information on data gaps for indicators in the Green
Growth Index by region and their implications on the number of
countries.
If there were no missing values, the index could be computed for
about 243 countries globally. Due to data gaps, however, the current
index has been computed only for 117 countries. The data gap is the
largest for the indicators for green economic opportunities, with
Oceania and the Americas having as high as 82% and 55% missing
values, respectively. Data gaps for each country are presented in
Chapter 7 Statistical tables.
5.3.3 Sustainability targets
Because the sustainability targets are benchmarked against
the Green Growth Index, the policy relevance of the scores to
measure the distance to internationally agreed goals depend on
the reliability of these targets. The targets were grouped into three
types (Table 8): SDG targets, other targets, whose sources are not
from the SDG indicators, and the mean of the top five performers.
If the targets are not available from the SDG indicators and other
reliable literature, they were computed based on the average values
of the top five performing countries (bottom five5 performing
countries for negative relationship to green growth). About 30%
of the targets remained based on mean values of the top five
performing countries, allowing countries to already reach the
targets regardless of their performance on a given indicator. The
mean values of top performers in the share of green employment
in manufacturing to total employment, for example, is only 14%.
This allows the countries to already have a score of 100 at this
low level of green employment. An important step to improve the
Green Growth Index is, thus, to have a valid and sufficient basis
for the targets of the indicators which are currently not considered
in any internationally agreed goals such as SDGs, Climate Paris
Agreement, and Aichi Biodiversity Target. This holds particularly
for the available indicators for green economic opportunities.
GGGI will continue to request the producer or publisher of data to
recommend targets for the indicator. If this will not be possible, the
experts of the international expert group will be sought to come up
with agreed targets for the purpose of the Green Growth Index.
The targets in the Green Growth Index were aligned as much
as possible with the SDG targets, using the information on
sustainability targets applied in relevant global indices such as the
SDSN’s SDG Index and OECD’s SDG Indicators. The SDG targets
are either explicit or implicit. Because implicit SDG targets leave
room for interpretation, different targets were given to the same
SDG indicator (Table 8). For the Green Growth Index, the GGPM
team did not attempt to interpret the SDG targets but used the
available interpretation, such as that suggested by OECD (OECD,
2019a, 2019b) and by SDSN (Sachs et al., 2019; Sachs et al., 2018).
Whenever the suggestions on the targets diverge, the team adopted
the SDSN targets because, as with the Green Growth Index, the
SDSN methodology was developed based on the global context.
In the future, the alignment with the SDG targets will continue to
be important to provide consistent policy recommendations to the
countries.