Appendix 1
Summary of Methods
- Introduction
- Global Review
- Regional Outlook
- Country Performance
- Expert Consultations
- Ongoing applications and collaborations
- Statistical Tables
- Appendix 1 Summary of methods for the Green Growth Index
- Appendix 2 The international expert group
- Appendix 3 List of expert reviewers
- Appendix 4 The GGPM Team
- Partners
A. Index Development
Process
A.1 Iterative Approach
GGGI adopted a thorough process in designing the Green Growth
Index through iterative activities including expert consultations,
assessment of expert feedback, and quality improvements. GGGI
pursued two complementary strategies to enhance the relevance
and practicality of the Index in policy making:
• A stepwise scientific approach through rigorous research to
understand the complexity and multi-dimensionality of green
growth; and
• A consultative process involving experts and other stakeholders
to determine the policy relevance of the indicators at the national
and regional contexts.
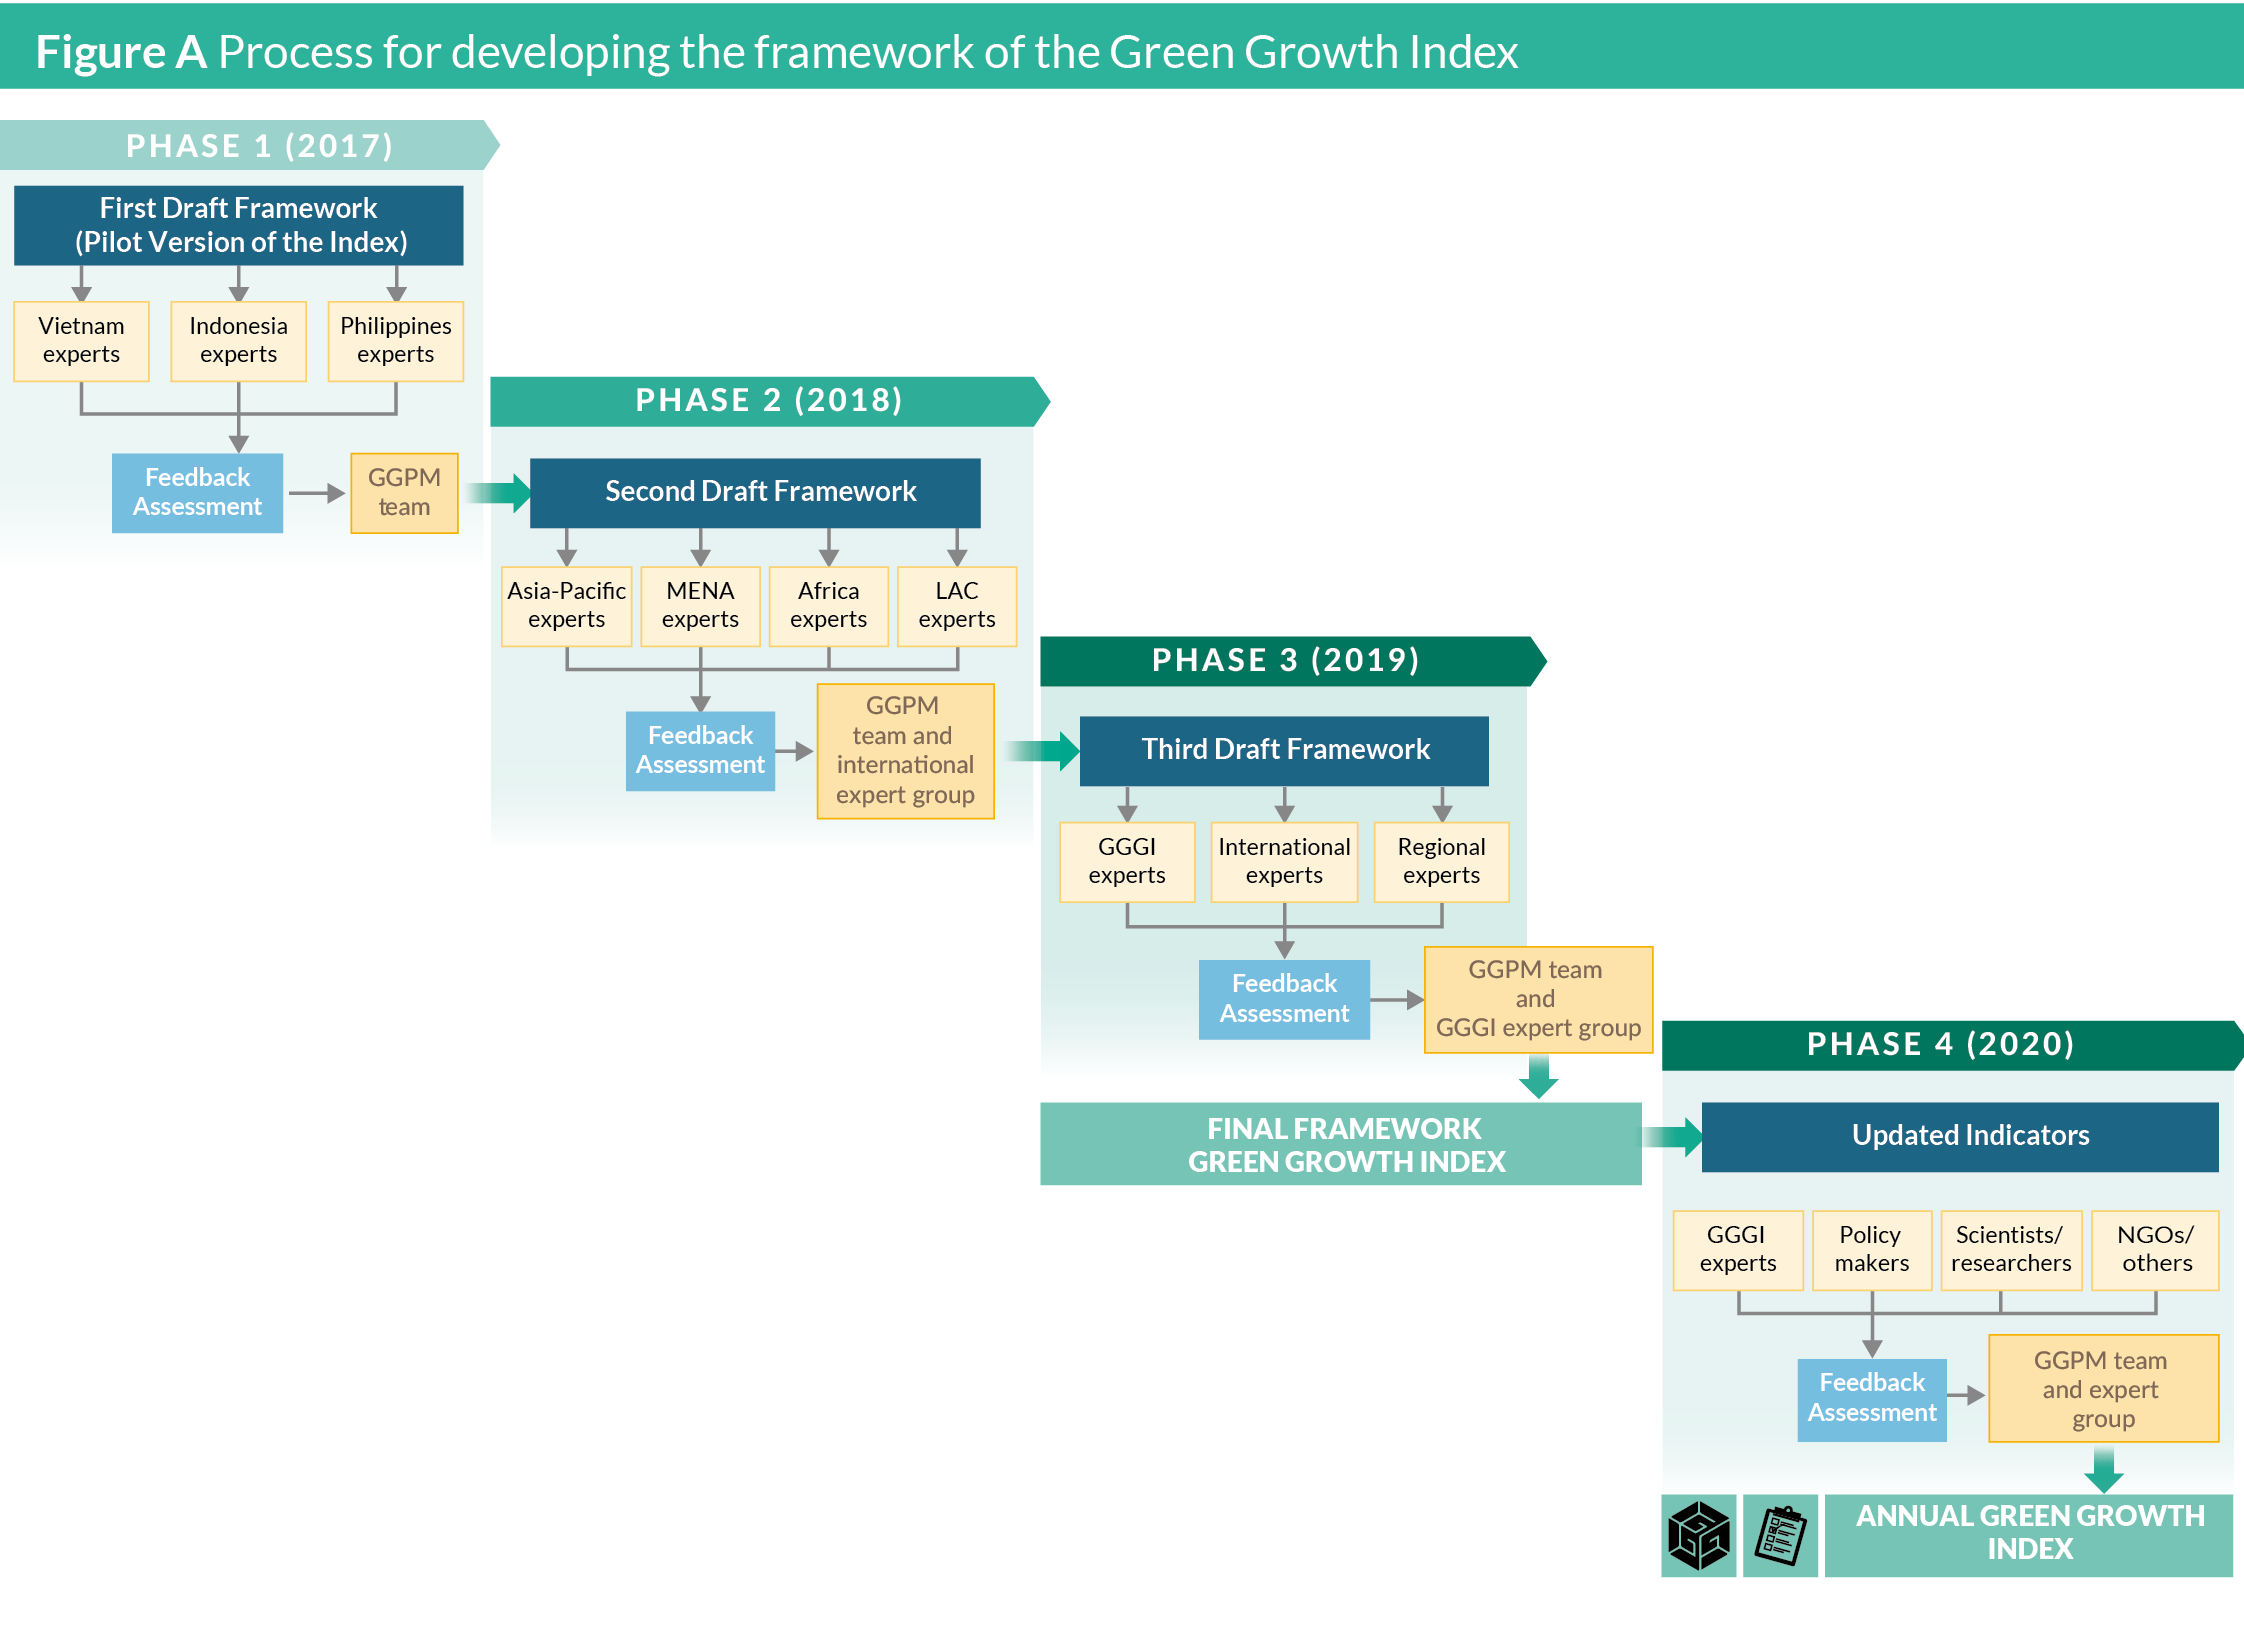
A.2 Participatory Approach
The stakeholder engagement process was initiated in 2016 and
completed in early 2019. The three main phases included:
1. Phase 1 – Pilot: GGGI developed a pilot version of the Index
covering 34 GGGI member and partner countries2. The Index
was presented in an international expert workshop at GGGI
headquarters in Seoul, South Korea, three in-country stakeholder
workshops (in Vietnam, Indonesia, and the Philippines), and an
international stakeholder consultation during Global Green
Growth Week 2017 in Addis Ababa, Ethiopia. These consultative
activities aimed to inform GGGI member countries about the
ongoing process of developing the Index and collect initial
feedback.
2. Phase 2 – Regional Consultations: GGGI presented the revised
framework incorporating the preliminary feedback in 2018
in four regional consultation workshops for the Asia-Pacific
Region (Bangkok), Middle East (Dubai), Africa (Addis Ababa),
and Latin America and the Caribbean (Mexico City), as well as
an international expert meeting in Geneva. These workshops
served as a platform for dialogue and interaction among the
stakeholders to ensure a transparent process for improving the
Index. Outcomes of the workshops were presented during an
international expert meeting in Rome, Italy.
3. Phase 3 – Expert Consultations: The last phase of the Index
development process involved the circulation of the draft technical
report on the concept, methods, and applications of the Index to
the internal and external experts for their review and feedback.
GGGI collected expert feedback through an online survey. GGGI
also conducted two additional expert consultations—the first with
GGGI thematic experts to align the Index to the priority areas of
the Institute and the second with selected research institutions
and international organizations3 to validate the sustainability
targets. These expert inputs from the online survey and
consultations were used to finalize the Index.
4. Phase 4 – Annual Expert Consultations: The fourth phase of the
Index development process is the expert consultations which are
conducted every year to continuously improve the indicators
of the Green Growth Index. As discussed in chapter 5.3 Next
steps forward and as indicated in Table 4, missing green growth
indicators will need to be included and proxy variables will still
need to be replaced with more relevant indicators when data
become available in the next years. Detailed description of this
year’s consultations is discussed in chapter 5 Expert consultations
and Appendix 2.
B. Analytical and Empirical
Methods
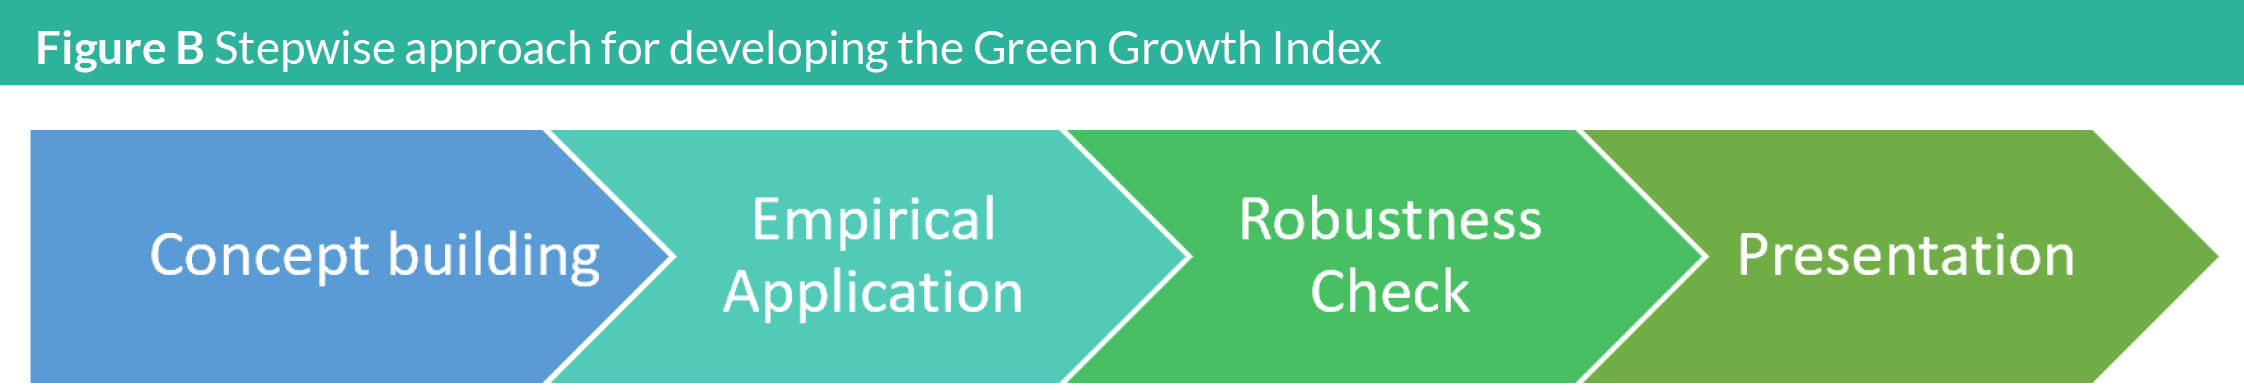
B.1 Stepwise Analytical Approach
In building the Green Growth Index, GGGI applied a stepwise
approach that conforms to “good practices” in developing composite
indices4 (Figure B). A composite index combines a number of
indicators into a single score, which facilitates the comparison,
ranking, benchmarking, and monitoring of progress for multifaceted,
complex phenomena.
The development of the Green Growth Index followed four key steps:
• Concept building entails defining the objectives of the Index,
conceptualizing green growth, and identifying its dimensions
and indicators;
• Empirical application requires addressing methodological
issues such as indicator selection, data preparation (i.e.,
scaling, imputation, outliers, correlation), normalization,
weights, and aggregation of indicators;
• Robustness check involves assessing the explanatory power
of the Index through correlation analysis and changes
in model inputs and its impacts on aggregation through
sensitivity and uncertainty analyses; and
• Presentation focuses on communicating the results at the
global, regional, and country scale using various diagrams
and tables.
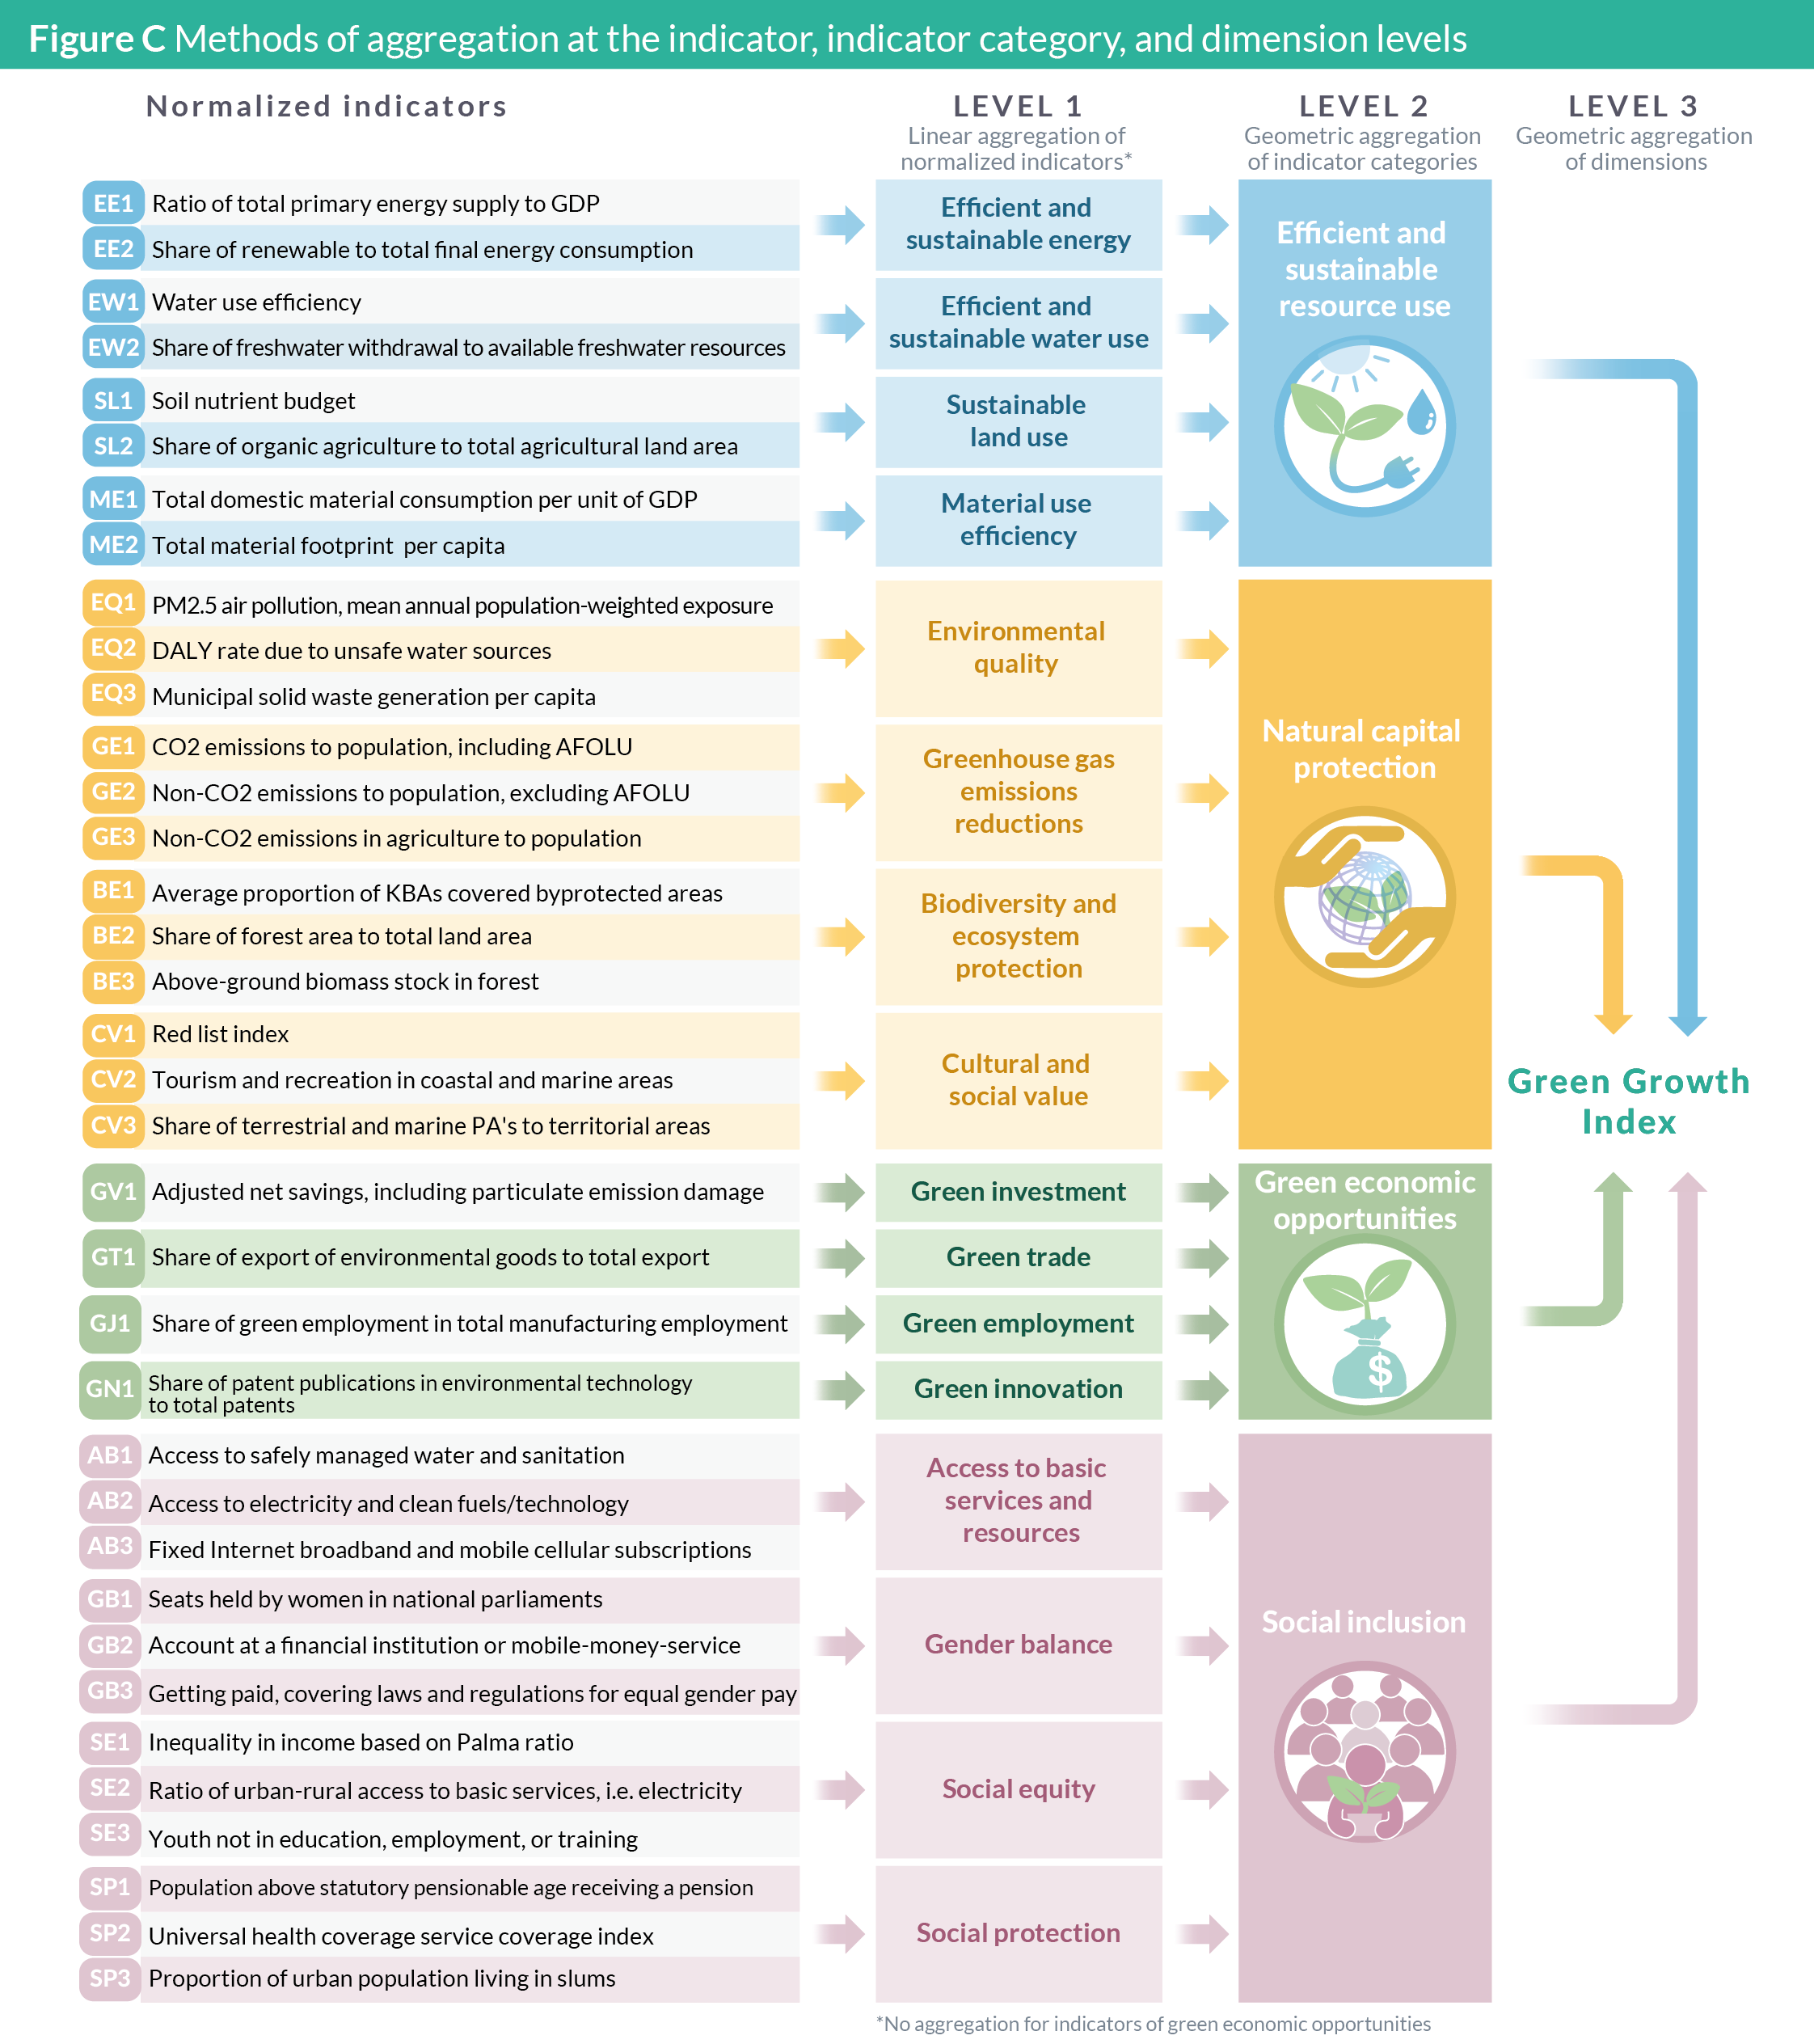
B.2 Empirical Steps
The Green Growth Index was constructed through aggregation of
the normalized indicators (metrics), indicator categories (pillars),
and dimensions (goals) (Figure C). Prior to the aggregation, several
steps were necessary to select, prepare, and validate the indicators
included in constructing the Index:
1. Indicator selection: Several criteria were applied in the
selection of indicators, including the relevance of the data
to the green growth dimensions based on conceptual and
empirical evidence, coverage of more than 140 countries
(including most GGGI member and partner countries);
availability of time-series data to allow updates of the Index
on a regular interval; accessibility of the data to ensure
replication of methods and credibility of their sources; and
acceptable level of association with other indicators in the
same dimension. In a few cases, however, the criteria for
country coverage and time-series data were waived due to
a significant lack of data. All data were collected from online
sources, mainly published in the UNSTATS SDG database
and databases from other international organizations (e.g.
FAO, World Bank, WIPO, UN COMTRADE, etc.).
2. Data preparation: Scaling and imputation are the most
important methods to prepare the data and improve the
comparability of the indicators. Scaling the data with an
appropriate denominator (e.g., GDP, land area, etc.) allows
an objective comparison across small and large countries.
Available data for all the indicators were scaled except
for the GHG emissions, export of environmental goods,
and patents of environmental technology. Imputing data
based on the available time-series data helps improve the
country coverage of the indicators. To minimize the effects
of imputation on data uncertainty, the simple method of
imputing data from the closest years was applied.
3. Data validation: The most important method to validate
the statistical appropriateness of the indicator data is
to check for outliers and correlation. Since outliers can
distort statistical properties and normalized values of the
indicators,5 their values were capped using lower or upper
fences based on the interquartile range from 75th and
25th percentiles. The aims of the correlation analysis are to
identify redundant indicators with very strong correlation to
improve the explanatory power of the indicators and verify
whether indicators have acceptable levels of association
in their respective dimensions. Indicators with very strong
correlation were excluded from the framework and replaced
with ones having acceptable levels of association.
4. Indicator weights: The indicators have implicitly equal
weights (i.e., no weights are attached to them). The explicit
weights of the indicators are not equal because the number
of indicators in each indicator category (or pillar) is not
equal. The results from Principal Component Analysis
validated the level of inequality in the explicit weights of
the indicators. The results from Analytic Hierarchy Process
revealed that there is low consensus among experts on the
weights to be assigned to the indicators.
5. Indicator normalization: To translate the indicators with
different units into a common scale, it is necessary to
apply a normalization method. Through normalization, the
indicator values measured in different units can be adjusted
to a single scale to make the data comparable across the
indicators. The re-scaling method (min-max transformation)
for normalization was applied for the following reasons: it is
the simplest and most widely used method that will facilitate
ease of comprehensibility and replication; the use of upper
and lower bounds will reduce issues related to outliers;
and the integration of the targets will allow benchmarking
against sustainability targets.
The normalized indicators were used as inputs to the aggregation
model (i.e., level 1) as presented. The two most common and simple
methods of aggregation include linear aggregation using arithmetic
mean and geometric aggregation using geometric mean. These two
methods have different underlying assumptions. Linear aggregation
allows full and constant compensability, i.e. low values in one
indicator can be traded off (substituted) by high values in another.
On the other hand, geometric aggregation allows only partial
compensability, limiting the ability of the indicators with very low
scores to be fully compensated by indicators with high scores. The
two methods were applied in the different aggregation models so
that, as the level of aggregation increases, the level of substitutability
decreases:
1. Level 1: Arithmetic mean was applied to linearly aggregate
the normalized indicators, allowing compensability of the
individual indicators in each indicator category. Moreover,
at Level 1 of aggregation, countries with more than 25%
missing values were dropped.
2. Level 2: Geometric aggregation was applied to the indicator
categories to allow only partial compensability between
indicators in each dimension. Like in Level 1, the 25% rule on missing values was applied to the dimensions with more than missing values was applied to the dimensions with more than
four indicator categories, i.e., resource efficiency and green
economic opportunities.
3. Level 3: Geometric aggregation was applied on the
dimensions and the 25% rule on missing values was not
applied. At this level of aggregation, no dimension was
allowed to easily substitute the other dimensions to improve
the Green Growth Index.
Python software was used to conduct all the analysis described
above, except for the correlation analysis which was done in Prism
(GraphPad Software). Detailed discussion on the steps involved in
constructing the Green Growth Index is provided in chapter 5 of
GGGI Technical Report Number 5, Green Growth Index: Concepts,
Methods, Applications (Acosta et al. 2019).
C. Validating and Improving
the Index
Composite indices often face criticism because they can be
misleading if badly constructed and interpreted.6 Thus, the final
important step in developing a composite index is the evaluation
of the confidence in the model and its underlying assumptions (i.e.
robustness check).
Three different types of analyses were conducted to validate the
robustness of the Green Growth Index:
• Explanatory power: Using regression models, the ability of
the indicators and their aggregated values (i.e., indicator
categories, dimensions) to explain the structure of the Index
was analyzed.
• Sensitivity analysis: The sensitivity of the Green Growth
Index to changes in the input variables of the aggregation
model at Level 1 was analyzed.
• Uncertainty analysis: The uncertainty analysis evaluates the
impact of the assumptions made and methods used to build
the model on the Index.
The results from the regression models suggested that sufficient
variation in the Green Growth Index is explained by the dimensions,
indicator categories, and indicators, while those from sensitivity
and uncertainty analyses showed that the Green Growth Index is
robust with respect to changes in model inputs and assumptions.
Details of the results for the 2019 Green Growth Index are provided
in chapter 5 of GGGI Technical Report Number 5, Green Growth
Index: Concepts, Methods, Applications (2019) and GGGI Technical
Report Number 9, Green Growth Index: Robustness Check (2019).
Those for 2020 Green Growth Index will be published in a technical
report that will be dedicated to the validation of the Index and its
updated list of green growth indicators.
1 Information in this Appendix was adapted from Acosta, L.A., C.O. Balmes, R.J. Mamiit, P. Maharjan, K. Hartman, O. Anastasia, and N.M. Puyo. (2019). Assessment and Main findings on the Green Growth Index, GGGI Insight Brief No. 3, Green Growth Performance Measurement, Global Green Growth Institute, Seoul, South Korea. https://greengrowthindex.gggi.org/wp-content/uploads/2020/04/GGGI-Insight-Brief-No.-3_Final.pdf
2 “Members” refer to countries that have submitted their instrument of accession to GGGI and formal membership has commenced while “partner countries” include countries where GGGI has operations and those that have formally communicated their intent to become a Member.
3 IASS, PIK, FAO, SDSN and OECD.
4 Nardo, M., Saisana, M., Saltelli, A., & Tarantola, S. (2005). Tools for Composite Indicators Building. Ispra, Italy: European Commission Joint Research Centre: Institute for the Protection and Security of the Citizen Econometrics and Statistical Support to Antifraud Unit; OECD & JRC 2008, op. cit.
5 Mishra, S. K. (2008). Construction of Composite Indices in Presence of Outliers. SSRN Electronic Journal, 1-5. https://doi.org/10.2139/ssrn.1137644; OECD & JRC 2008, op. cit.; Ibid.
6 Saisana, M., & Tarantola, S. (2002). State-of-the-art report on current methodologies and practices for composite indicator development. European Commission, pp. 1–72. https://doi.org/10.13140/RG.2.1.1505.1762