Green Growth Index:
Ongoing applications and collaboration
- Introduction
- Global Review
- Regional Outlook
- Country Performance
- Expert Consultations
- Ongoing applications and collaborations
- Statistical Tables
- Appendix 1 Summary of methods for the Green Growth Index
- Appendix 2 The international expert group
- Appendix 3 List of expert reviewers
- Appendix 4 The GGPM Team
- Partners
6.1 Regional Green Growth
Index
6.1.1 African Green Growth Index
Collaborator: African Development Bank (AfDB)
GGGI is collaborating with the AfDB to develop the second phase
of the African Green Growth Index by applying GGGI’s conceptual
framework for green growth. The first phase or pilot version of the
African Green Growth Index was developed in 2015 (AfDB, 2015).
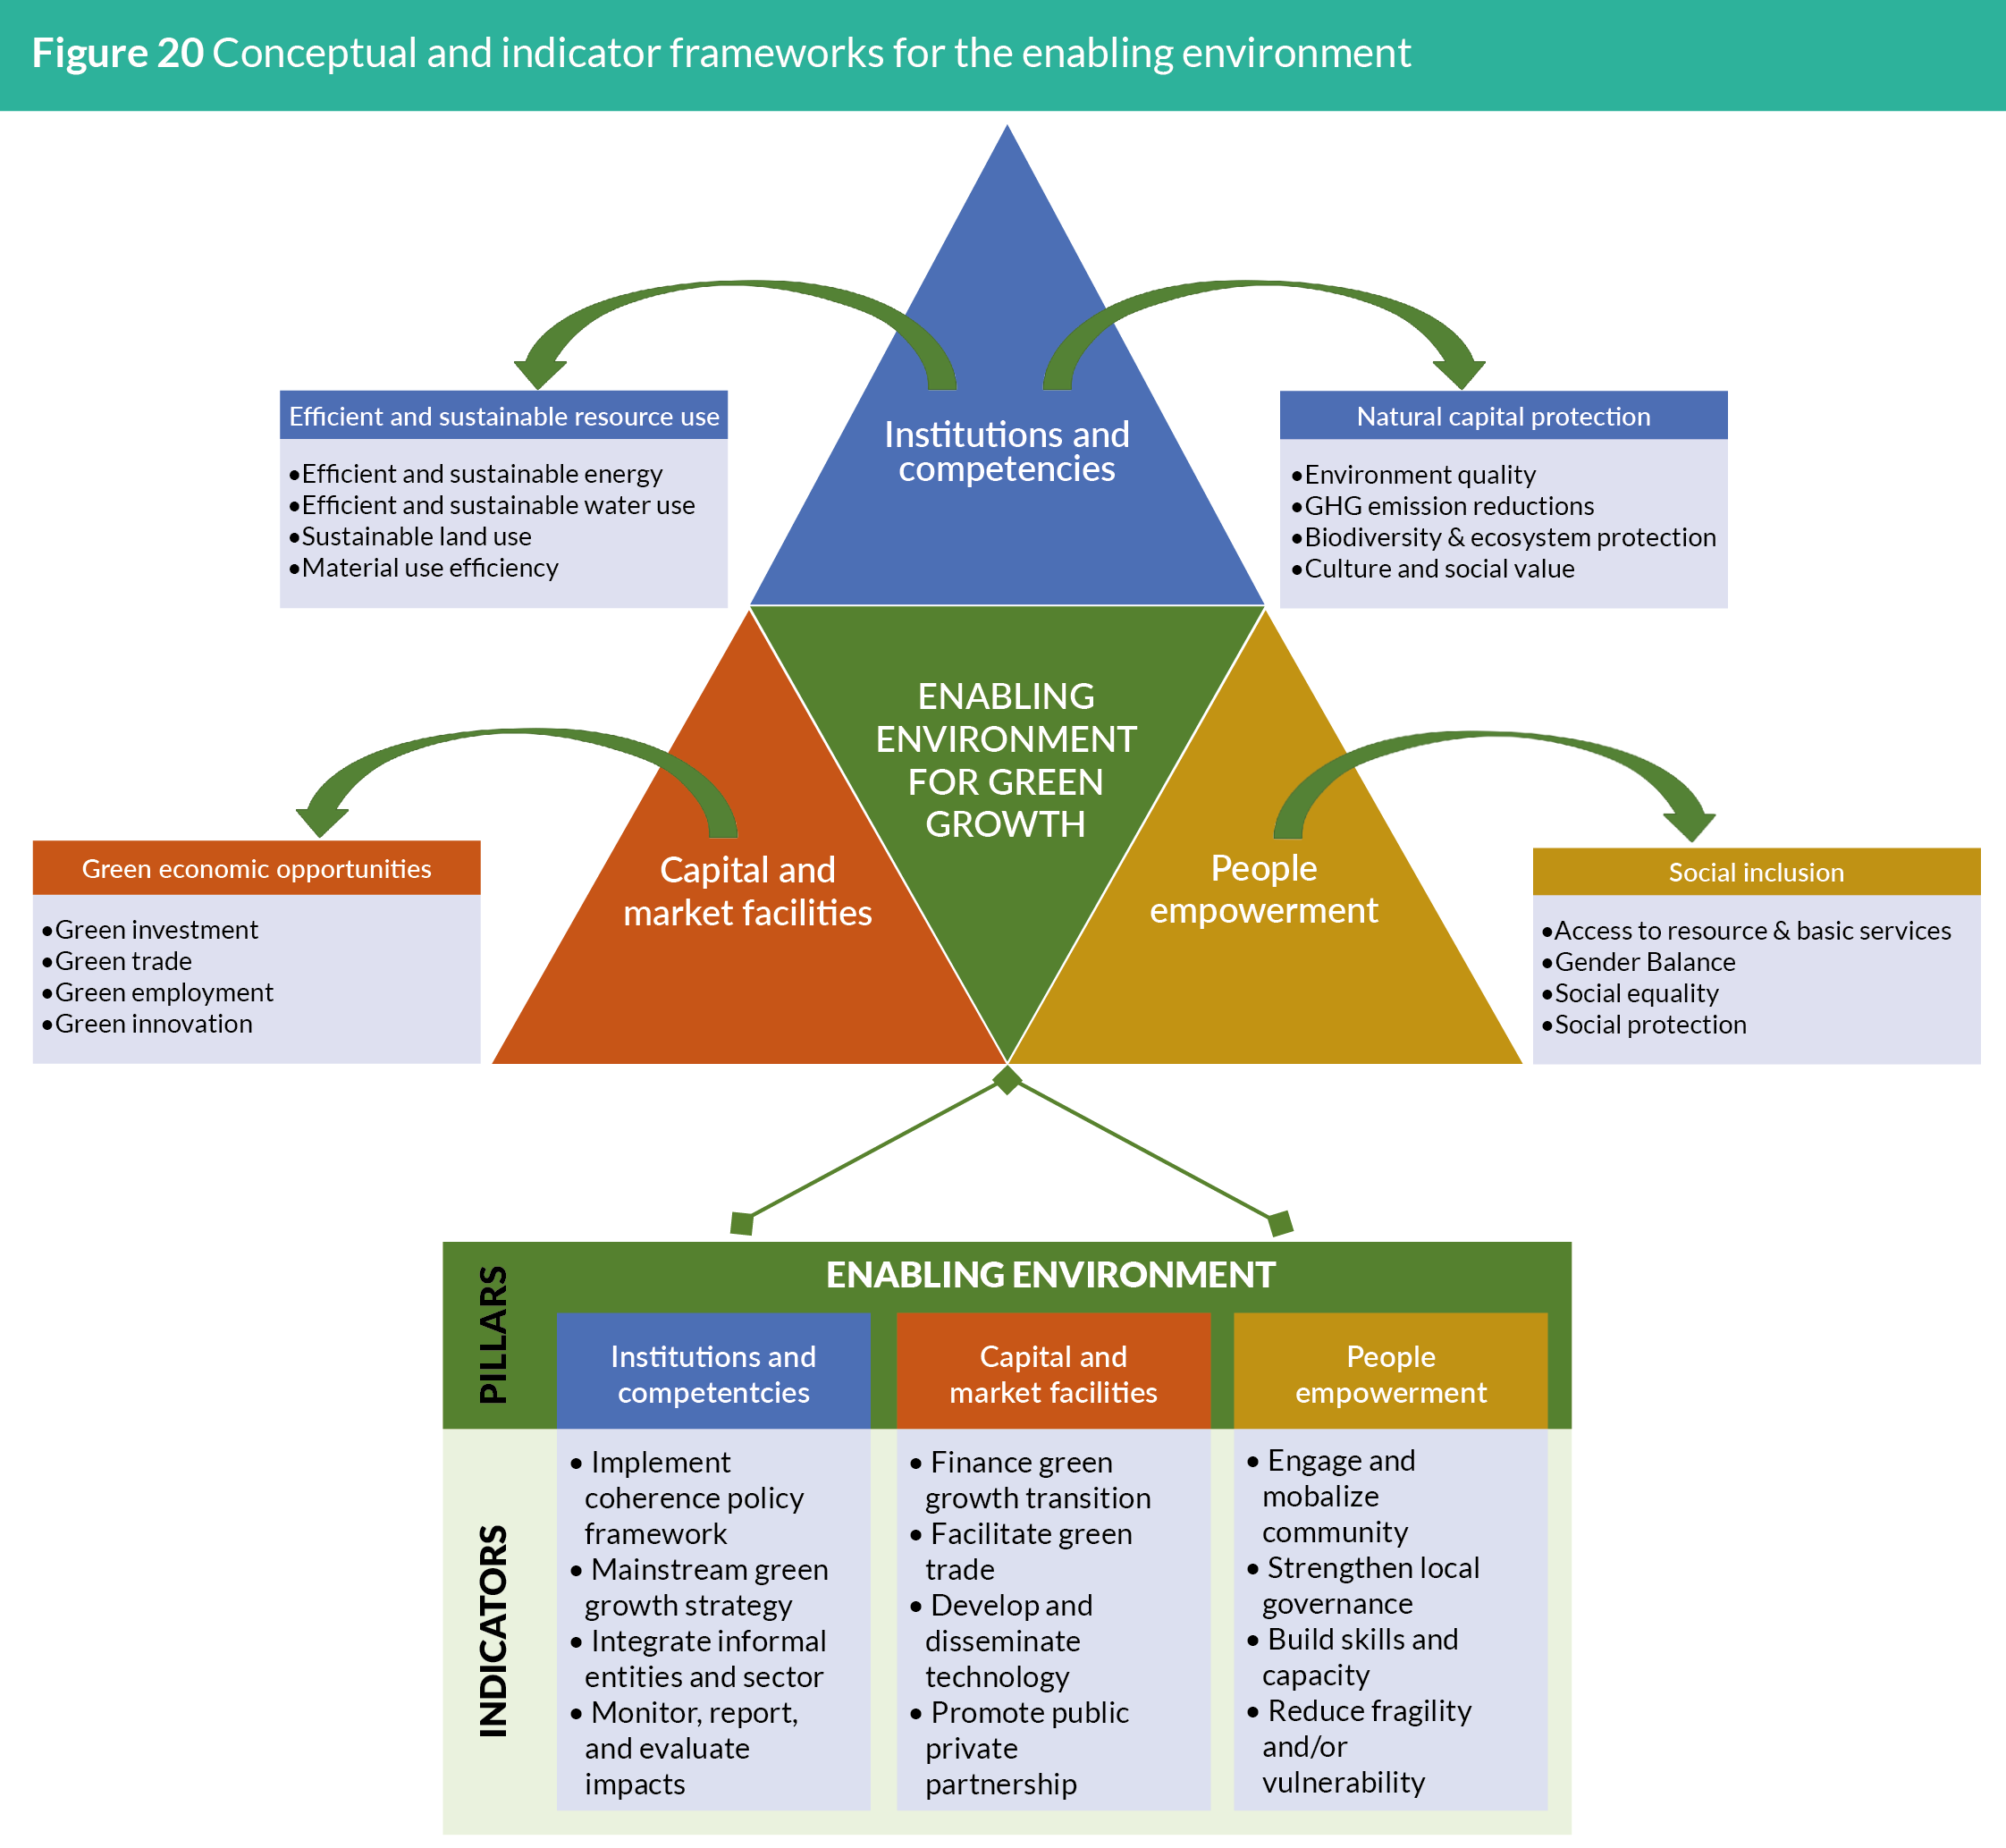
Through the collaborative project, two main improvements were
identified – addition of indicators for green economic opportunities
and dimension on enabling environment, considering the regional
social, economic, and environmental contexts. The conceptual
and indicator frameworks for enabling environment have been
developed (Figure 20), with the former identifying the links of the
enabling environment pillars (or indicator categories) to the four
dimensions of the Green Growth Index and the latter providing
guidance for the selection of the indicators for these pillars. The
next steps ahead will be to (1) identify quantifiable indicators
for institutions and competencies, capital and market facilities,
and people empowerment, (2) conduct stakeholder dialogues to
validate the relevance of the indicators to policy, (3) inventory
and collect data for the validated indicators, (4) identify proxy
variables for indicators with insufficient data, (5) compute the
Green Growth Index (to include additional indicators for green
economic opportunities and enabling environment), (6) conduct
expert consultation through online survey to collect feedback on the
African Green Growth Index, (7) publish the report on the Index, and
(8) conduct capacity building to transfer Index model and database
to the AfDB.
6.1.2 OECS Green Growth Index
Collaborators: Organisation of Eastern Caribbean States (OECS)
Commission and GGGI OECS Office
The Eastern Caribbean countries have a very high ratio of sea
to land space. The OECS Commission has established several
regional frameworks related to the blue economy and ocean
space planning to support these countries (e.g. OECS Blue/
Green Economy Strategy, Eastern Caribbean Oceanscape Plan).
Currently, there is no coherent measurement tool to track and
monitor the goals and actions included in these frameworks and
other related environmental sustainability frameworks (e.g. St
Georges Declaration, Biodiversity Framework). As a result, OECS
has expressed a desire to incorporate the indicators related to the
blue economy into the Green Growth Index. The collaborative
project, which activities were initiated this year, includes the
review of relevant regional frameworks and assessment of how
blue economy indicators can be incorporated into the Green
Growth Index, conduct of a series of educational webinars/
stakeholder dialogues to inform OECS members and gauge
interest from stakeholders on the use of the Index, assessment
of data availability for the blue economy indicators agreed during
the dialogues, and computation of the index for blue economy
dimension to complement the Green Growth Index.
6.2 National Green Growth
Index
Collaborators: Uganda National Planning Authority (NPA),
GGGI Country Office Uganda
Uganda’s NPA in partnership with the European Union and GGGI
is undertaking a review of the Third National Development Plan
(NDPIII) draft Programme Implementation Action Plans to integrate
Green Growth principles, interventions, and outputs. The main
objective of the review is to mainstream green growth and climate
change into the entire NDP III document and results framework.
Further to mainstreaming, GGGI is supporting the NPA to develop
a national Green Growth Index based on the indicators identified
for each NDPIII Programme, classifying them into green growth
indicators, “potential” green growth (PGG) indicators, and enabling
environment indicators. The green growth indicators are indicators
that could be included in one of the four dimensions of the Green
Growth Index. The PGG indicators are indicators that could be
included if they are modified to emphasize “green” components
or aspects, for example, identifying green exports from the total
exports and considering eco-tourism or sustainable tourism from the
tourism sector, etc. These indicators are included in the classification
for possible consideration in the preparation of the next NDPs as
data become available. The enabling environment indicators are
useful indicators to enable green growth transition. The assessment
of the indicators according to these three classifications has been
completed, which will guide the collection of data to be used to
compute the Index.
6.2.2 Assessment of COVID Recovery
Packages in OECS Countries
Collaborators: OECS Commission and GGGI OECS Office
OECS member countries have been hard-hit by the economic effects
of the COVID-19 pandemic and thus are implementing policies
to mitigate these effects. The countries are in various stages of
developing response strategies. For instance, Saint Lucia published
its Economic Recovery and Resilience Plan in July 2020, while
Antigua and Grenada are in the process of drafting recovery plans.
In order to encourage the development of recovery packages that
also contribute to green growth and sustainability goals, OECS is
interested in using the Green Growth Index to assess the effects of
these strategies from a green growth perspective.
GGGI’s Green Growth Index can be effectively used as a tool
to assess the impacts of COVID-19 recovery plans because its
framework is aligned to SDG indicators and targets, allowing for
measurement of social, economic, and environmental co-benefits.
Moreover, many of the green growth indicators are linked to
the COVID-19 features and/or impacts. For example, zoonotic
condition is impacted by habitat loss (due to unsustainable land
use and biodiversity loss), increased mortality is caused by access
to healthcare, job loss is affected by the degree of economic
diversification, etc. The multidimensional framework of the
Green Growth Index facilitates assessments of impacts of policy
decisions and actions related to COVID-19 recovery on various
environmental, economic, and social sustainability indicators. A
two-step approach of green growth performance and green cobenefits
assessments can be used to evaluate the co-benefits from
building COVID-19 resilience through green new deals, national
green growth plans, or climate action strategies. The assessment
will involve an inventory of green growth indicators relevant to
COVID-19 features and/or impacts, alignment of these indicators
to the Green Growth Index framework, collection and validation of
time-series data, and computation and assessment of Index scores.
6.2.3 Green Growth Performance in
Country Planning Frameworks
Collaborators: GGGI Green Growth Planning & Implementation
and Country Offices
GGGI’s Country Planning Framework (CPF) is a 5-year in-country
delivery strategy that identifies GGGI’s contribution to green
growth in member and partner countries in alignment with
GGGI’s Strategy 2030. The CPF process entails an assessment of
green growth challenges, opportunities, and enabling conditions,
identification of GGGI’s in-country comparative advantage, and
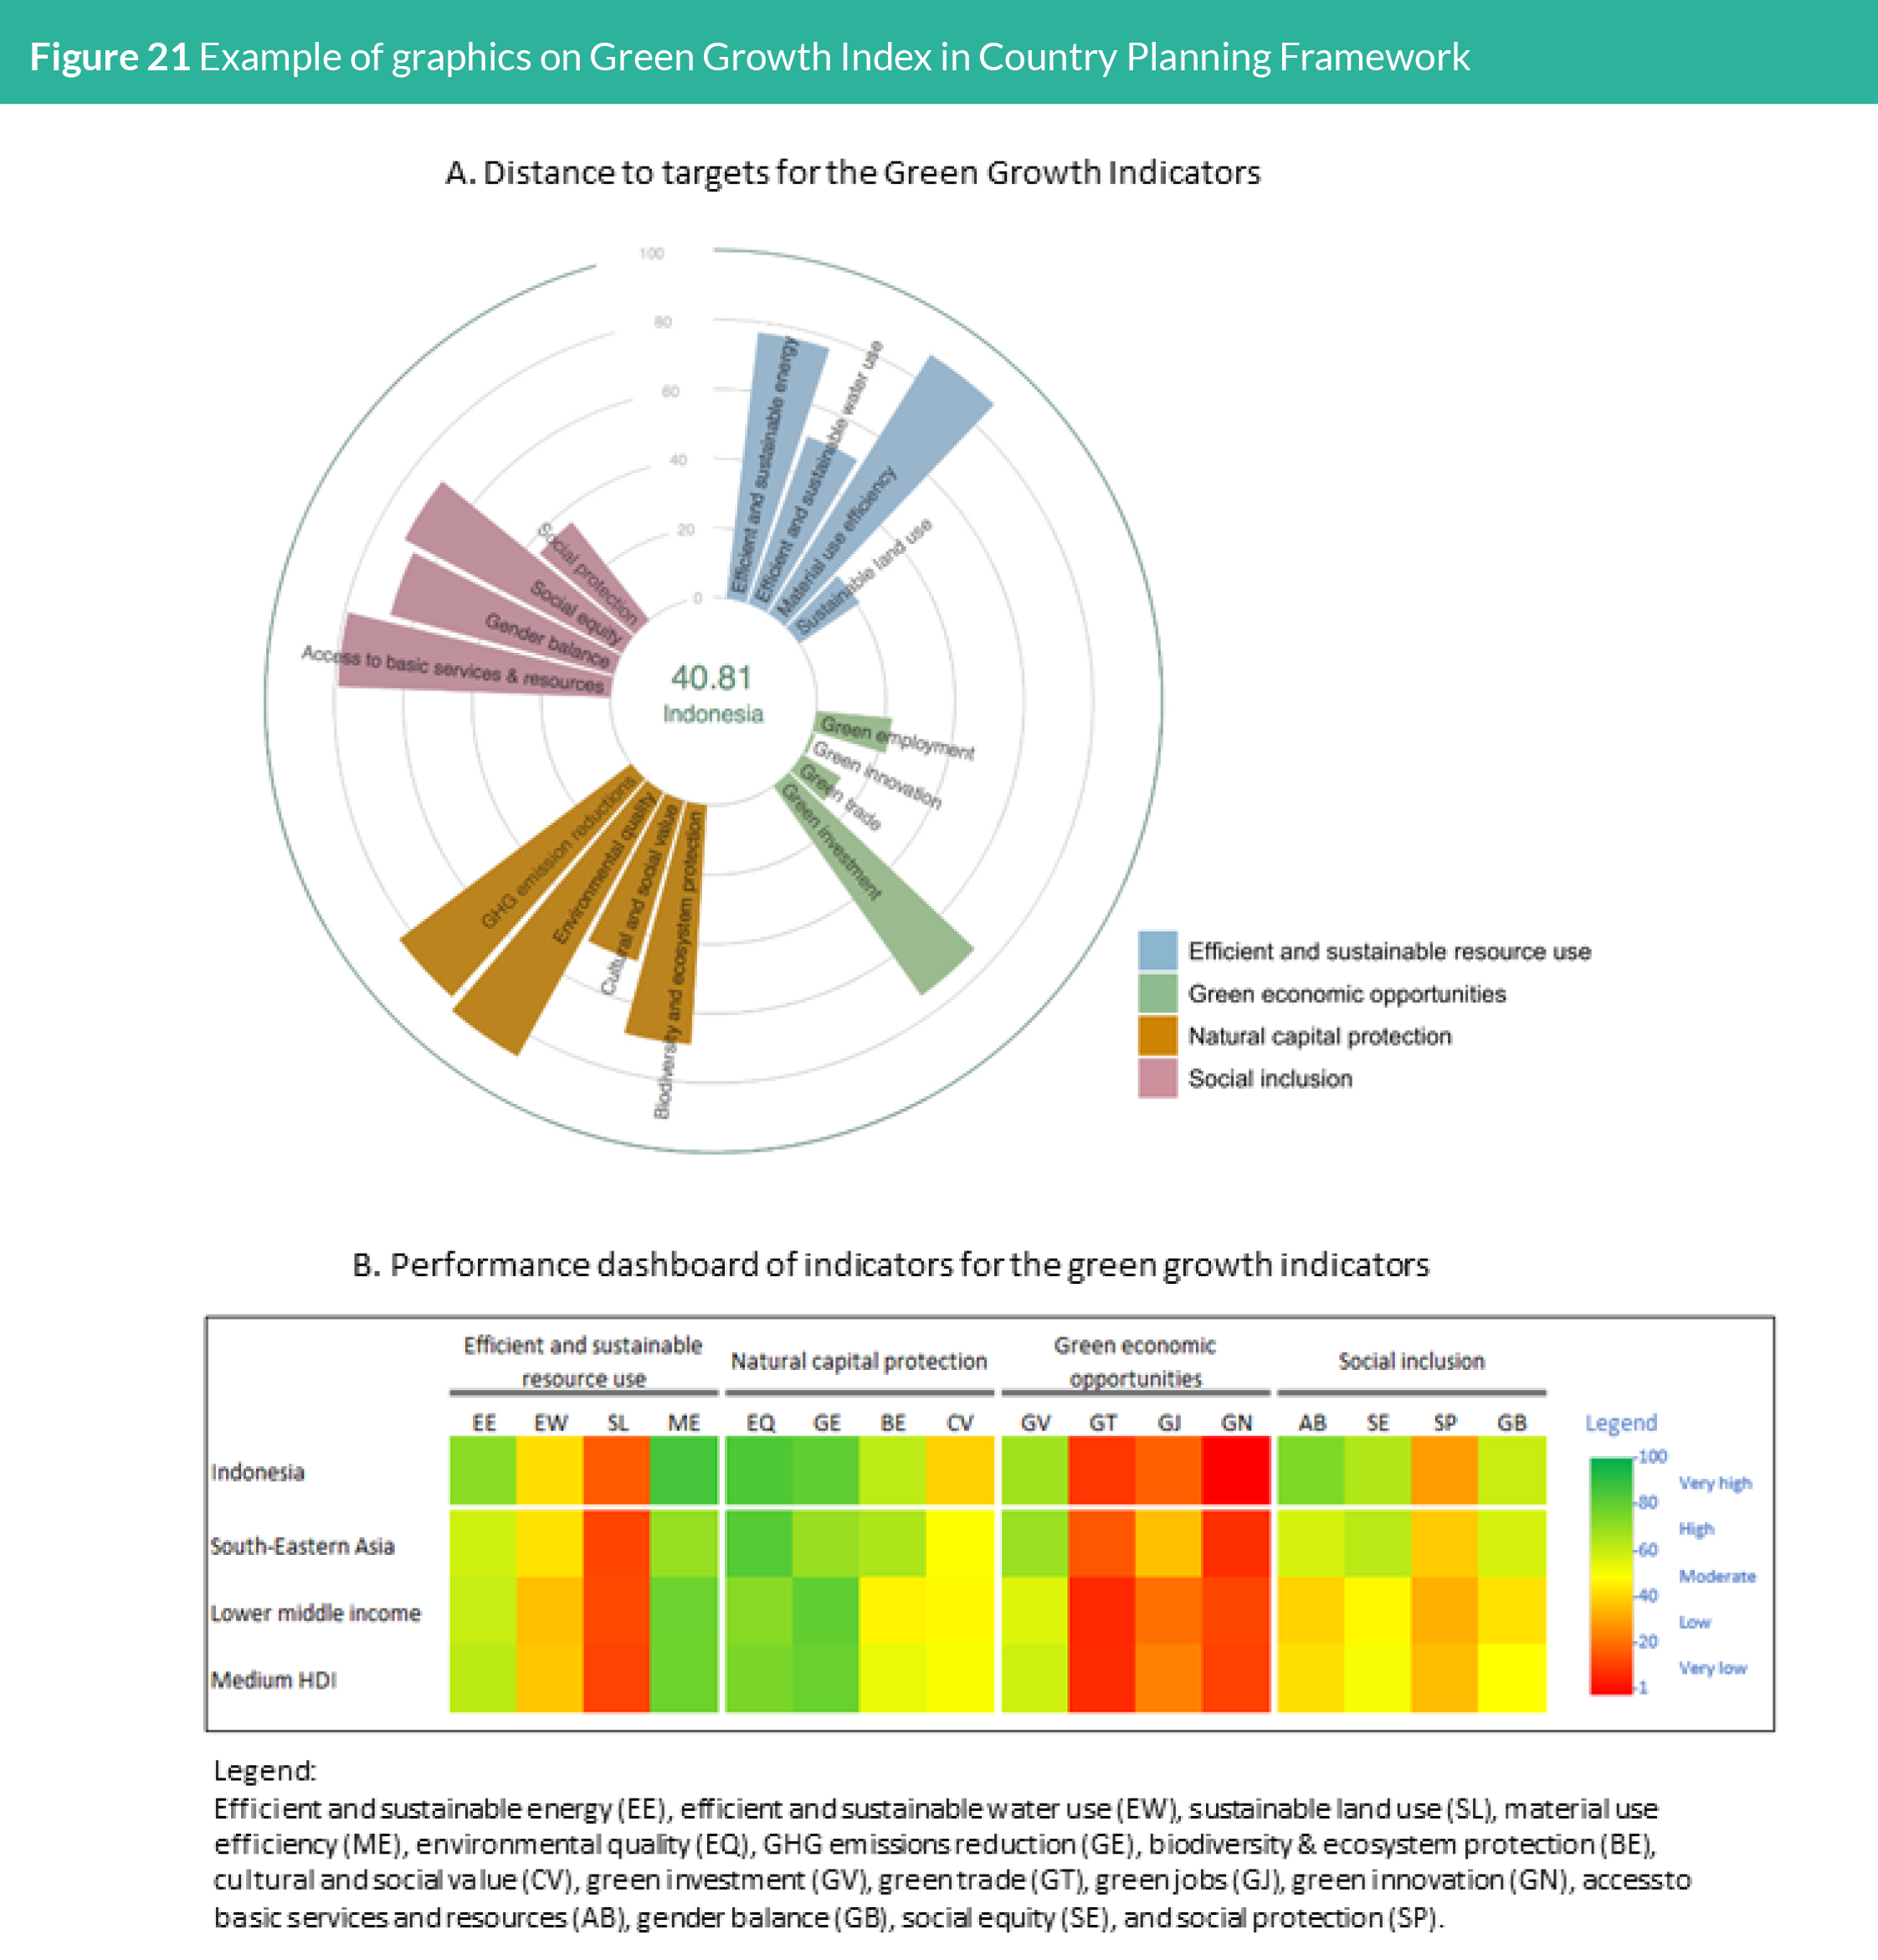
elaboration of priority interventions and intended results. Figure
21 presents examples of the graphics of the GGGI Index that are
included in the CPFs to highlight the current green growth trends
and performance against other relevant countries, by region and
economic development level. These results show where the policy
should focus and the opportunities that can be created to improve the performance on green growth indicators, as shown by the
following excerpts from the Indonesia CPF:
“Indonesia has generally performed well with an overall score of
40.81 in 2019, ranking 16 among 35 Asian nations. Among the
four green growth dimensions, performance in achieving targets
in green economic opportunities is the poorest (Figure 21A). In
comparison, Indonesia’s score at 12.30 is below the score of most
south-east Asian countries, representing an underperformance in
green investment, green trade, green jobs, and green innovation
(Figure 21B).
Herein, perhaps, lies Indonesia’s biggest opportunity to achieve
its national development targets: Green growth strategies to
accelerate investments and innovation to create and target new
economic opportunities, reinforcing the trajectory towards a
sustainable, socially inclusive economy.”
6.3 Green Growth Simulation
Tool
GGGI has developed both the Green Growth Index and Simulation
Tool to support the integrated assessment of green growth policies
and their impacts on green growth performance. The index measures
the country-level performance based on a common set of metrics
in four green growth dimensions. The Simulation Tool allows the
users to enhance their knowledge on how the different policy
options, not only within these dimensions but also across sectors,
influence a country’s green growth performance. The validity of the
underlying models and assumptions of the Simulation Tool depends
on the policy relevance of the indicators that frame the Green
Growth Index. Moreover, this Simulation Tool not only enhances
users’ understanding of green growth but also allows an interactive
learning experience. Users can manipulate input indicators,
experiment with different policy choices, and simulate the impacts of
their choices on green growth performance through their projected
effects on output indicators.
The development of the Simulation Tool follows three phases:
1. Phase 1 consists of identifying and applying models which
provide interlinkages among the indicators and require
available data online. Models that require data to be
collected from countries were kept first for use in Phase 2.
2. Phase 2 consists of conducting stakeholder dialogues to
create/identify policy scenarios and collect feedback on the
Phase 1 Simulation Tool. It also aims to improve the Phase 1
Simulation Tool by adding models that require data collected
from agencies and integrating feedback from stakeholder
dialogues.
3. Phase 3 consists of finalizing models and scenarios by
adopting lessons learned from different country applications
of the Phase 2 Simulation Tool and standardizing them for
more global applications.
During the Phase 1, which was completed in 2020, over 125 online
tools related to green growth were reviewed to determine the
best practices for developing online simulation tools and models.
Also, over 200 peer-reviewed articles were assessed to identify the
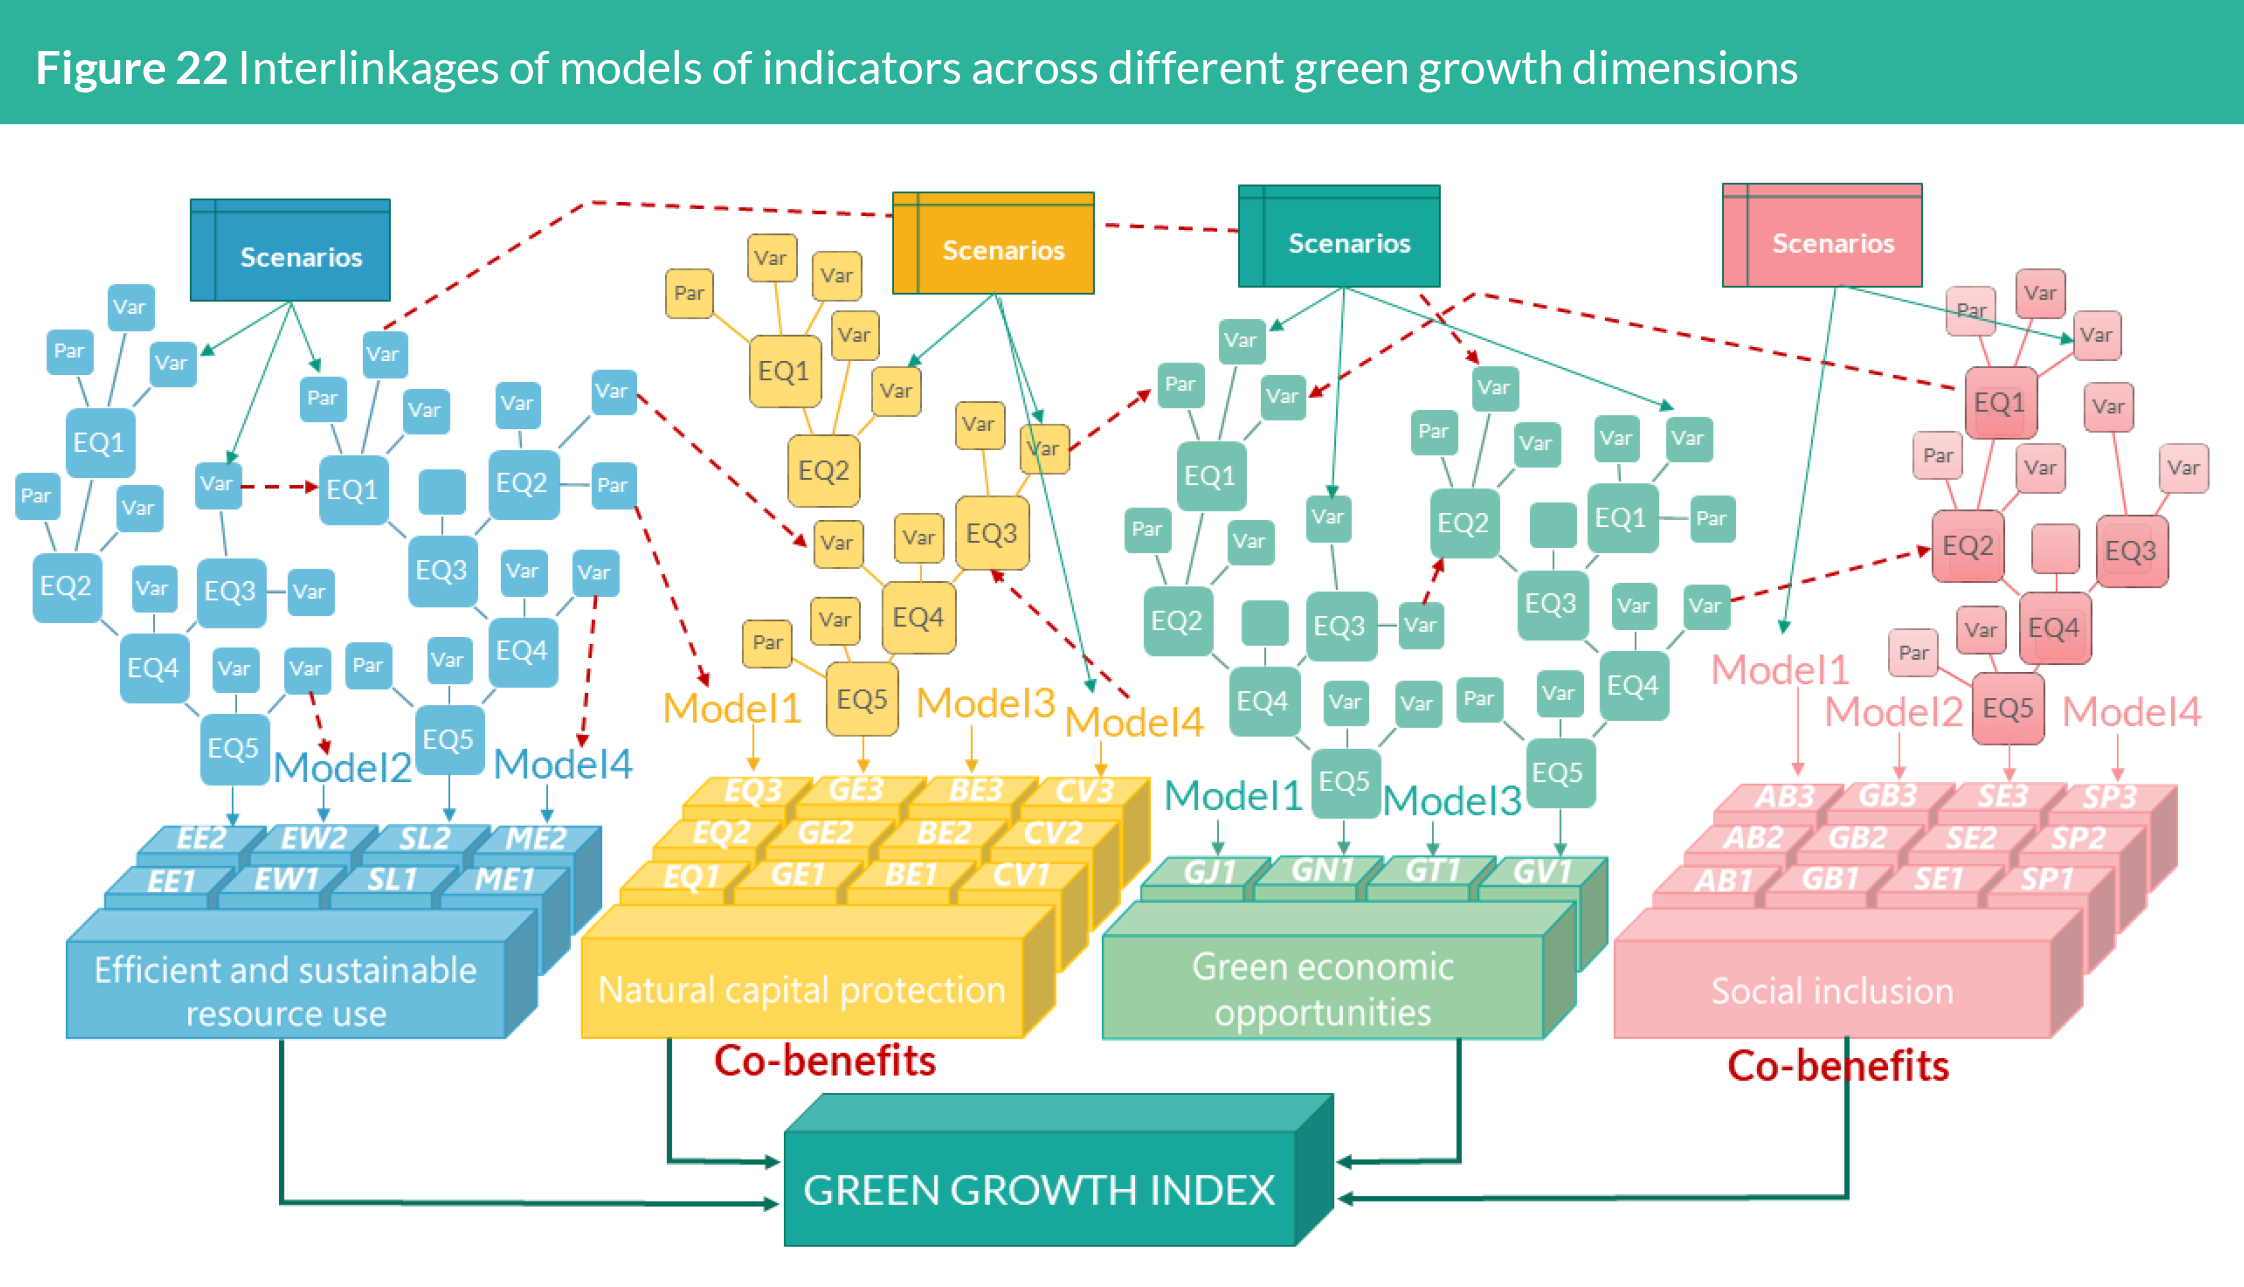
models that can be used in the Simulation Tool. A comprehensive
inventory of models was conducted to classify them for use in Phase
1 and Phase 2 development of the Simulation Tool. Figure 22 shows
the interlinkages of different models, which are relevant for the 36
indicators of the Green Growth Index, built and validated through
the following steps:
1. Collection of online data and running the model in Excel
2. Validation of results by comparing to actual data
3. Preparation of flow diagrams to represent the models
4. Translation of the equations run in Excel into Python codes
5. Validation of results consistency and flow diagrams
For Phase 1, the case study countries include Hungary, Mexico, and
Uzbekistan. In this study, policy and investment scenarios were
created for different sectors, which include:
• Energy – reducing coal production, increasing renewable
supply (e.g., solar, wind)
• Transport – increasing electric vehicle, using efficient
transport technology
• Water – implementing water pricing policies, improving
irrigation technology efficiency
• Agriculture – reducing production losses, reducing fertilizer
use
• Forestry – increasing reforestation or reducing
deforestation, applying climate smart forestry policies
• Waste – increasing recycling rate, reducing food waste
The Phase 2 Simulation Tool will also include social (e.g. population,
migration), economic (e.g. GDP growth, consumption), and climate
(e.g. temperature, precipitation) scenarios. The Simulation Tool thus
covers not only multiple sectors, but also multiple systems. It is based
on system dynamics models that measure the impacts of policy and
investment scenarios on important green growth indicators for
efficient and sustainable resource use (i.e. energy, water, land, and
materials), natural capital protection (i.e. environmental quality, GHG
emissions reduction, biodiversity and ecosystem protection, and
social and cultural value), green economic opportunities (i.e. green
employment, investment, trade, and innovation), and social inclusion
(i.e. access to basic services, gender balance, and social equity and
protection). Moreover, it is an integrated assessment tool that can
assess the impacts of policies and investments from green deals or
stimulus packages on specific sectors they intend to support and the
co-benefits on other parts of the society, particularly the poor and
vulnerable (i.e. social inclusion). The Simulation Tool will have the
following features:
1. It can simulate long-term progress relative to policy and
investment scenarios from present (baseline) year to 2030
and 2050.
2. It is tailored to the social, economic, and environmental
contexts of the country to improve long-term assessments of
green growth performance.
3. It is developed through a participatory approach to
enhance the relevance of the results for national policy and
planning, including priorities and timeline for achieving the
development goals.
4. It can be applied in close collaboration with the relevant
government agencies to facilitate the transfer of knowledge
and product.
6.3.1 COVID Green Recovery in
Hungary
Collaborators: Hungary GGGI Country Office and Ministry for
Innovation and Technology
In the context of the European Green Deal and Hungary’s national
climate neutrality commitment, GGGI has delivered various lowcarbon
scenarios using the Green Economy Model (GEM) over the
past months. These scenarios are showing positive impacts on GDP
and green employment. However, the critical question is how these
low-carbon scenarios are aligned with the SDGs which governments
are committed to achieve by 2030 and beyond. This question could
further motivate the uptake of green deal packages that contribute
to reducing not only GHG emissions, but also biodiversity loss and
social inequality. By assessing the co-benefits using the Simulation
Tool, it will be possible to determine the potential contribution of
the green deal on reducing biodiversity loss and social inequality.
These co-benefits are added social, economic, or environmental
benefits above and beyond the direct benefits of reducing GHG
emissions and the economic indicators already covered in the
analysis performed with GEM. They can include, for example,
improving gender balance, access to basic services, management of
natural resources, etc. The project activities will include stakeholder
dialogues for scenario building, data collection and model
application, and capacity building on the use of the Tool.
6.3.2 Green Growth Performance in
Uganda
Collaborators: Uganda NPA, GGGI Country Office Uganda
The third results framework, which is within a 30-year framework
to achieve the Uganda Vision 2040, contains a set of objectives, key
result areas, and targets, aligning to the stated theme of the NDPIII.
The ongoing collaboration on developing the Green Growth Index
will be complemented by the application of the Simulation Tool to
assess the potentials for achieving the 2040 visions. The application
of the Phase 1 Simulation Tool for Uganda is currently ongoing. The
following activities will include: (1) collection of data and addition
of the kept aside models in developing the Phase 2 Simulation
Tool; (2) conduct of stakeholder dialogues with policymakers to
identify most relevant policy/investment scenarios; (3) collection of
data to implement the scenarios identified from the dialogues; (4)
application, validation, and analysis of results from the application of
Phase 2 Simulation Tool; and (5) conduct of capacity building on the
use of the Tool to transfer knowledge to the policymakers.