Green Growth Index:
Country Performance
Conceptual Framework
- Introduction
- Global Review
- Regional Outlook
- Country Performance
- Expert Consultations
- Ongoing applications and collaborations
- Statistical Tables
- Appendix 1 Summary of methods for the Green Growth Index
- Appendix 2 The international expert group
- Appendix 3 List of expert reviewers
- Appendix 4 The GGPM Team
- Partners
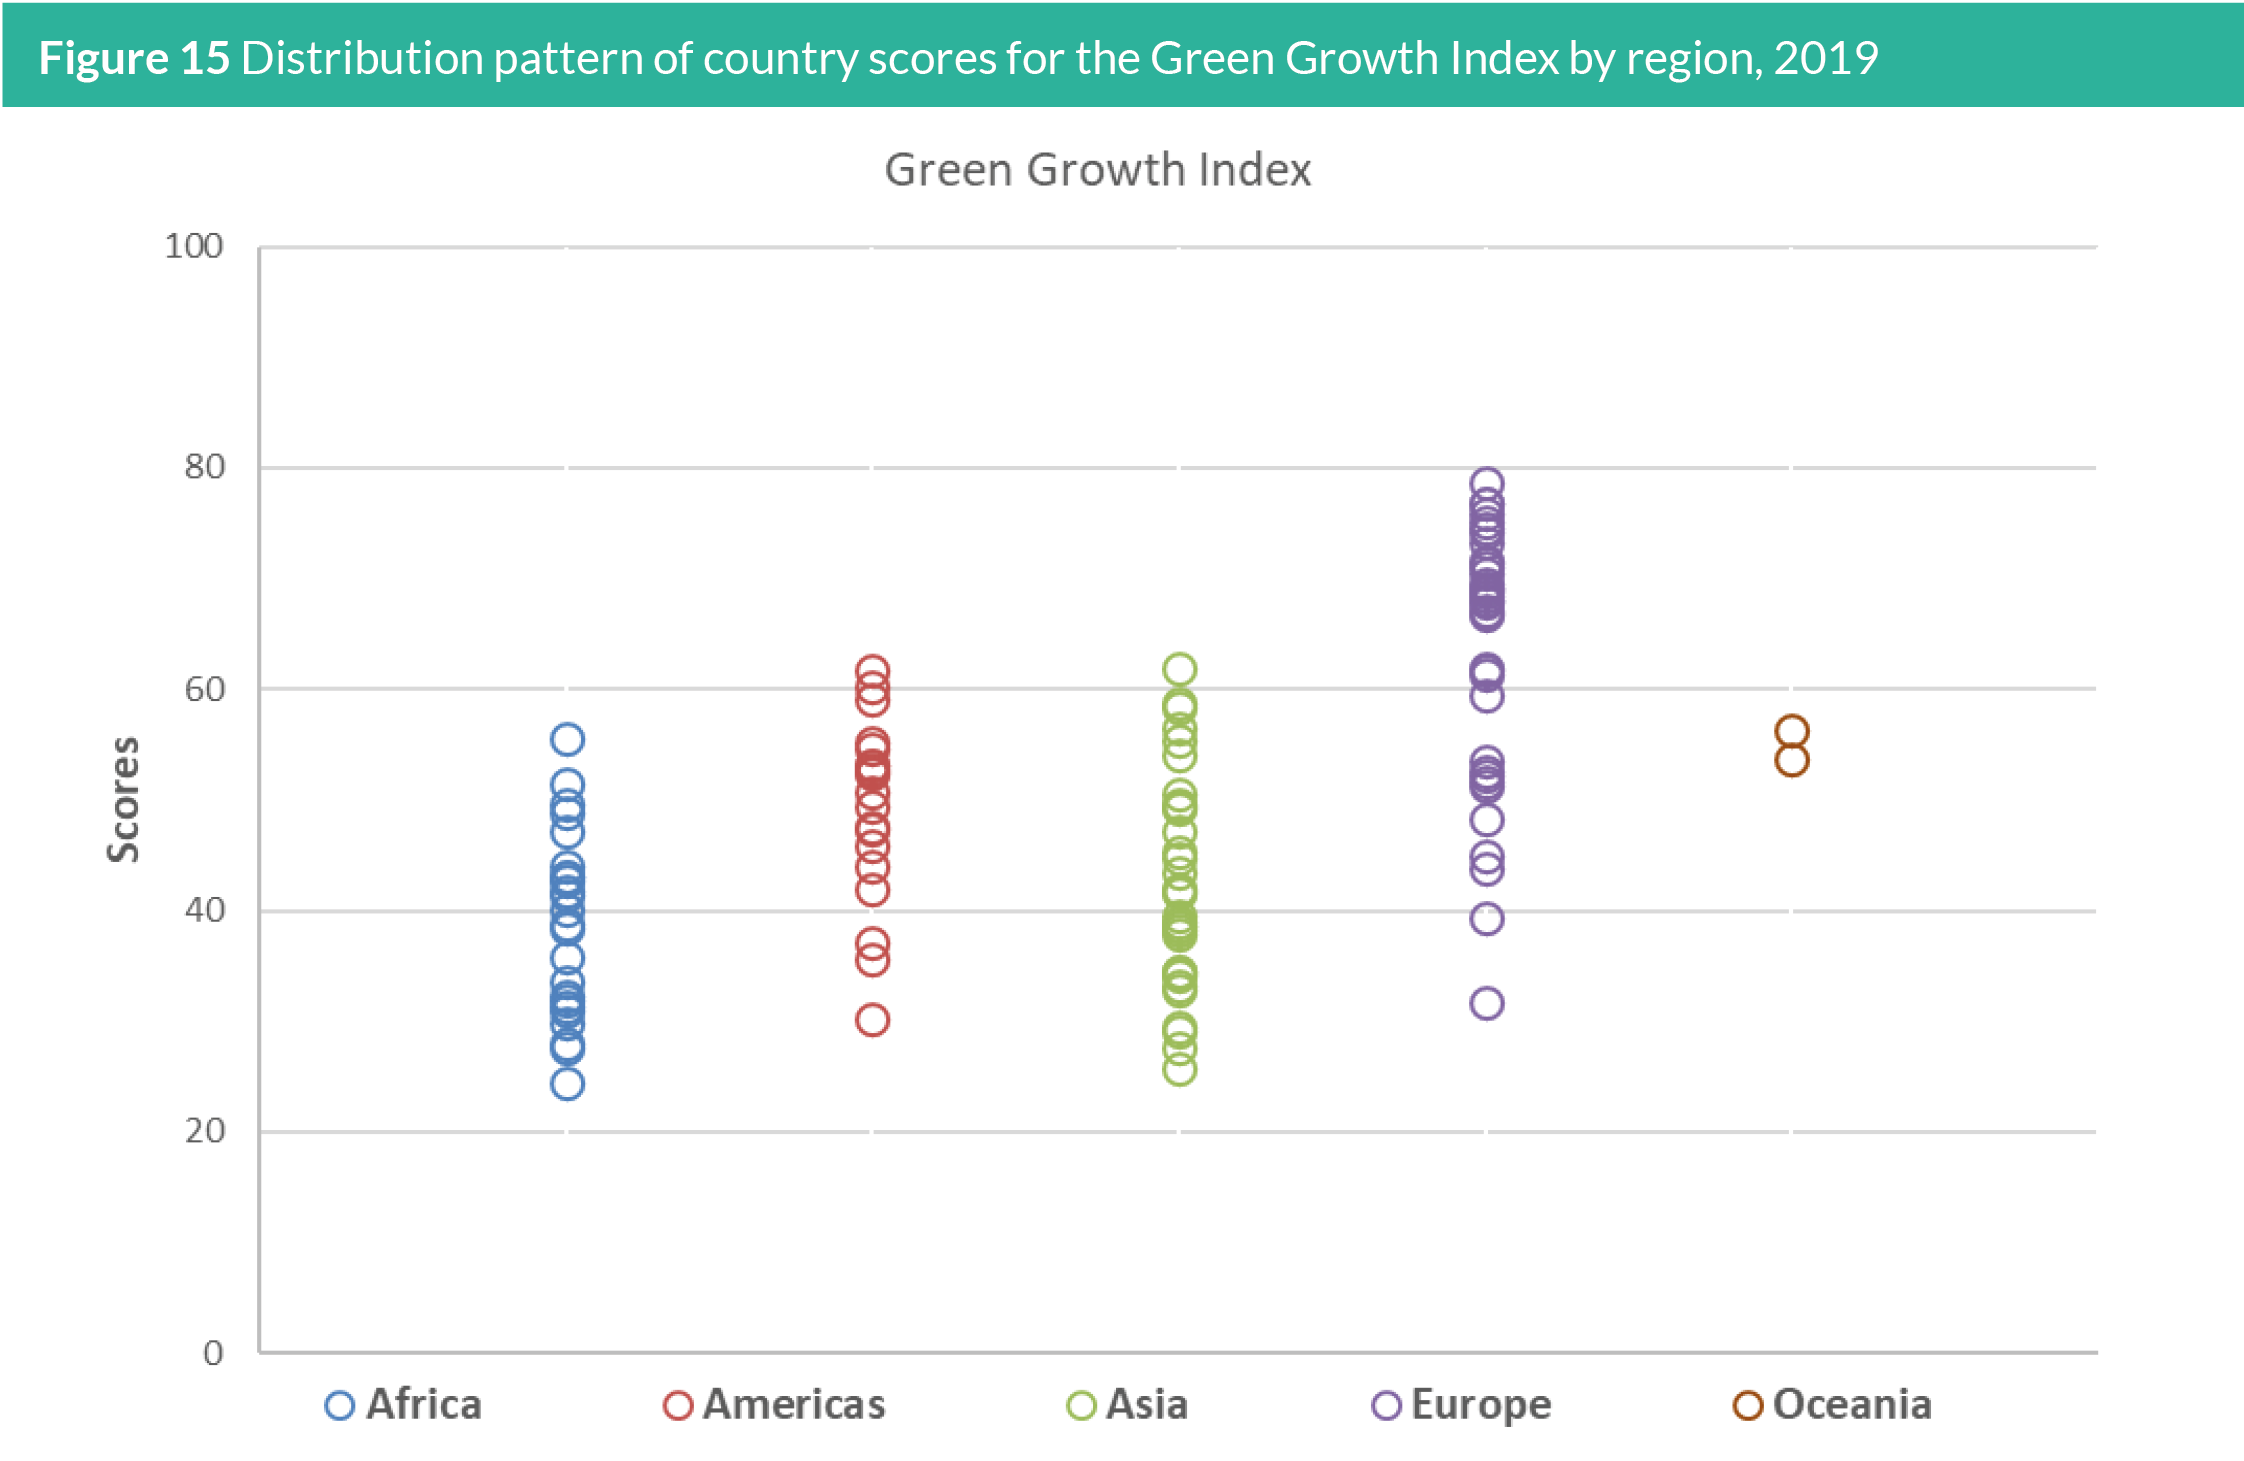
4.1 Country distribution
The scatter diagram in Figure 15 provides a different perspective
on the countries’ green growth performance by region. While the
distribution of scores across regions tends to be similar in range,
their positions on the Y-plane reveals that many countries in Europe
have high scores for the Green Growth Index, with values between
60 and 80. In contrast, countries in Africa, the Americas, and Asia
gather around scores between 20 and 60, which correspond to low
and moderate green growth performance. Oceania has only two
countries with Green Growth Index, New Zealand, and Australia,
that tend to follow the same distribution as the other three regions.
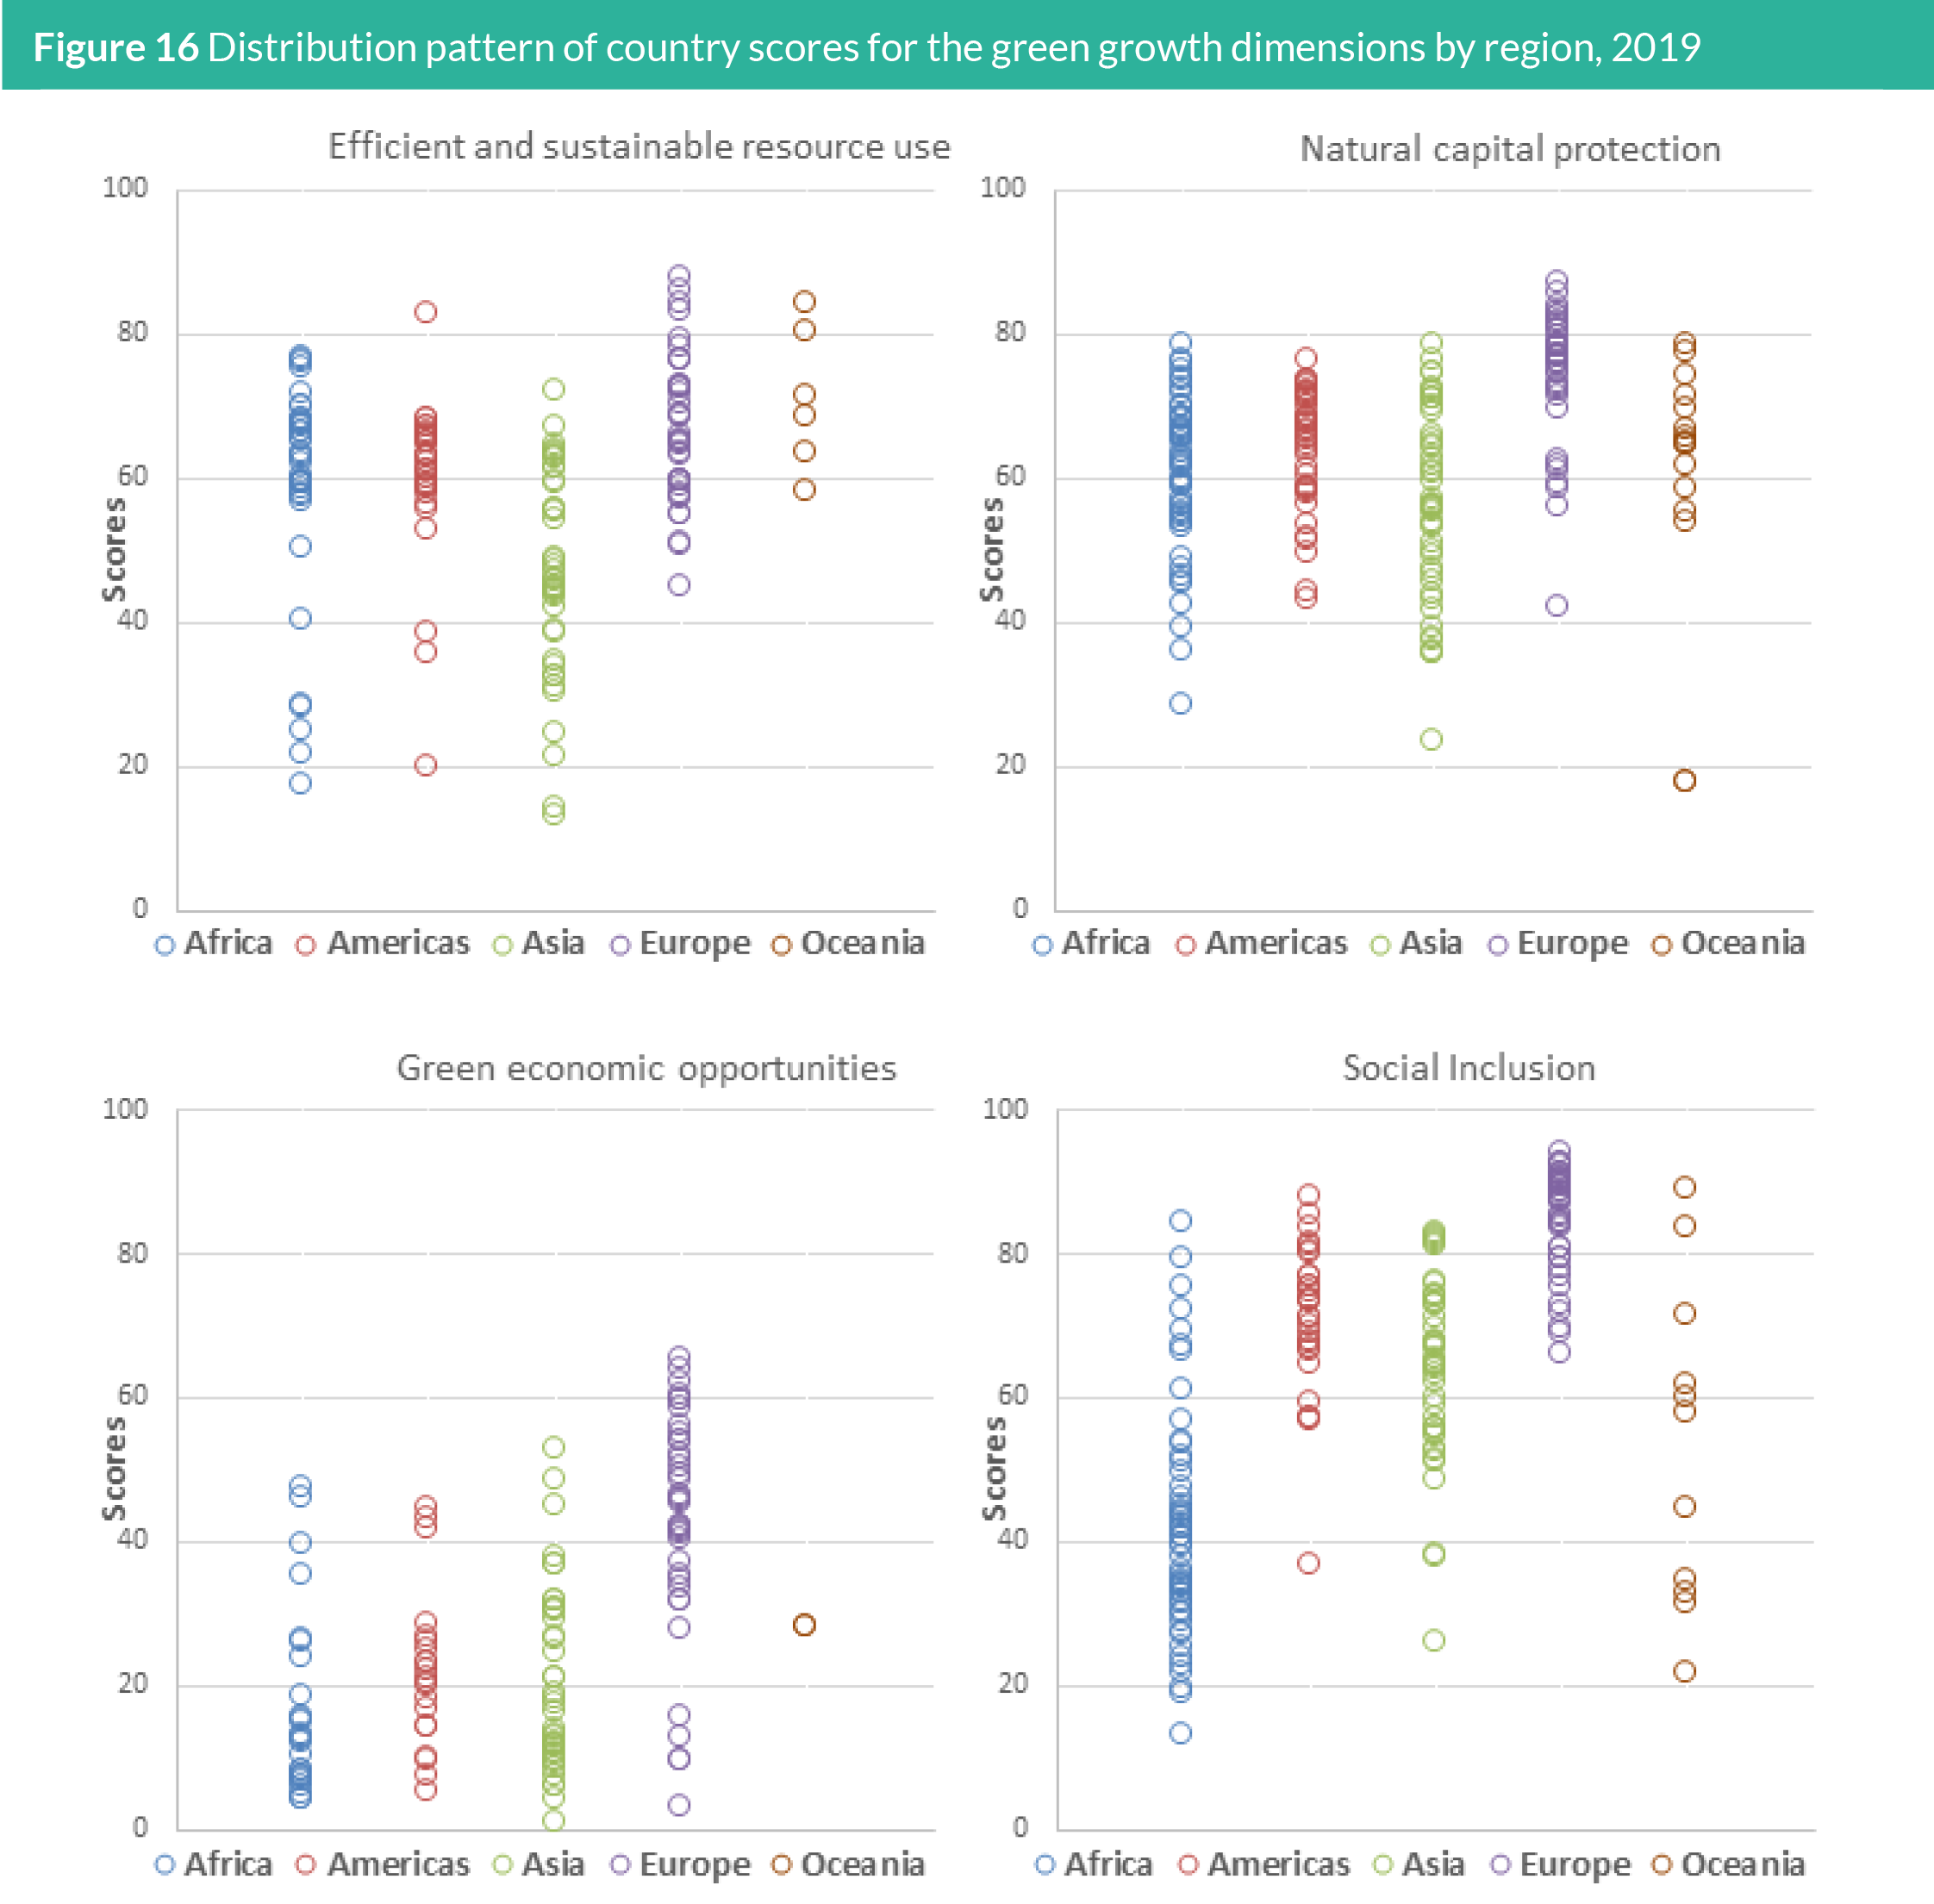
Figure 16 presents the distribution of countries for the four green
growth dimensions and reveals more information on the green
growth performance for other countries in Oceania. The lack of
data for green economic opportunities in Oceania prevented the
computation of the Green Growth Index for many countries in this
region. While country performance in Oceania in social inclusion
approaches those in other regions, it tends to follow the distribution
of countries in Europe as far as efficient and sustainable resource
use is concerned. It is noteworthy that while many countries in
Europe have better scores on green economic opportunities, many
European countries have also low and very low scores, similar to
most countries in other regions. The countries in Europe excel in
social inclusion where scores are all high and very high. This region
is approaching the sustainability goal of leaving no one behind. On
the other hand, this remains a big challenge in many countries in
Africa where half of the countries remain to have low performance
in social inclusion. The distribution of scores is promising for natural
capital protection where countries across regions tend to gather at
the upper end of the scatter diagram, which implies that they are all
racing to reach targets for this dimension.
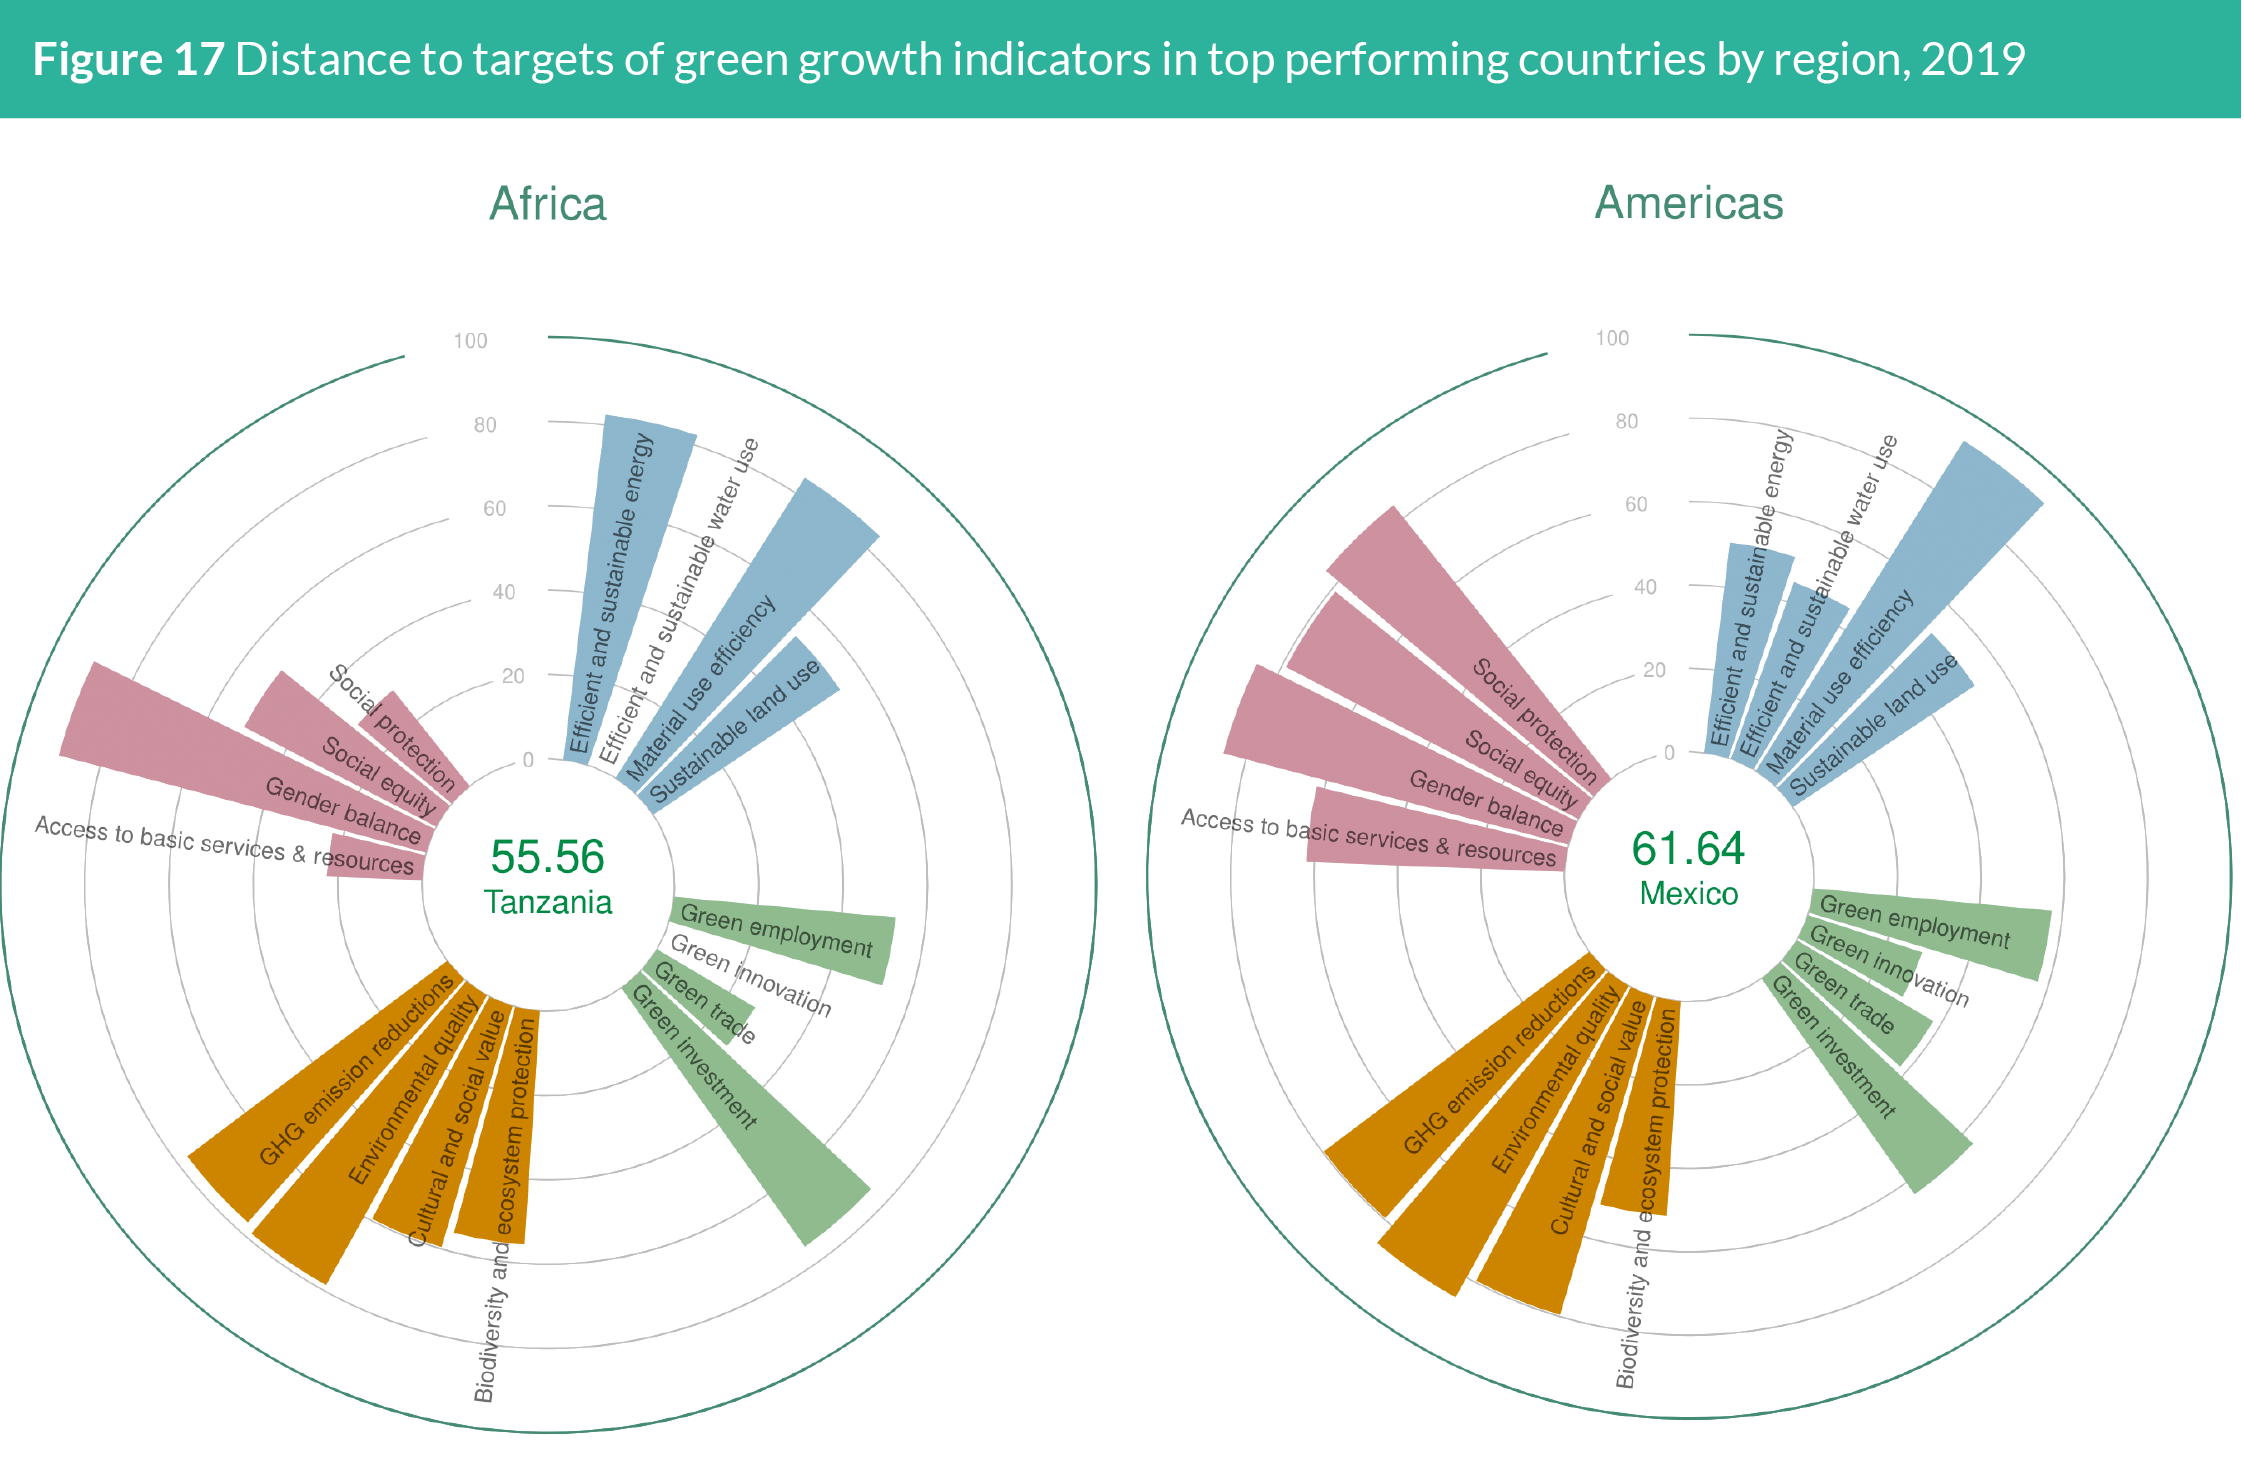
4.2 Best performers by region
The top ranking countries by region are Sweden in Europe with an
index score of 78.72, Japan in Asia with an index score of 61.83,
Mexico in the Americas with an index score of 61.61, New Zealand
in Oceania with an index score of 56.33, and Tanzania in Africa with
an index score of 55.56. Figure 17 shows the scores of the indicator
categories used to compute the Green Growth Index for these
five countries. It further shows the benchmarking method used for
measuring the distance of indicators to their sustainability targets.
Note that a score of 100 indicates that a target was reached.
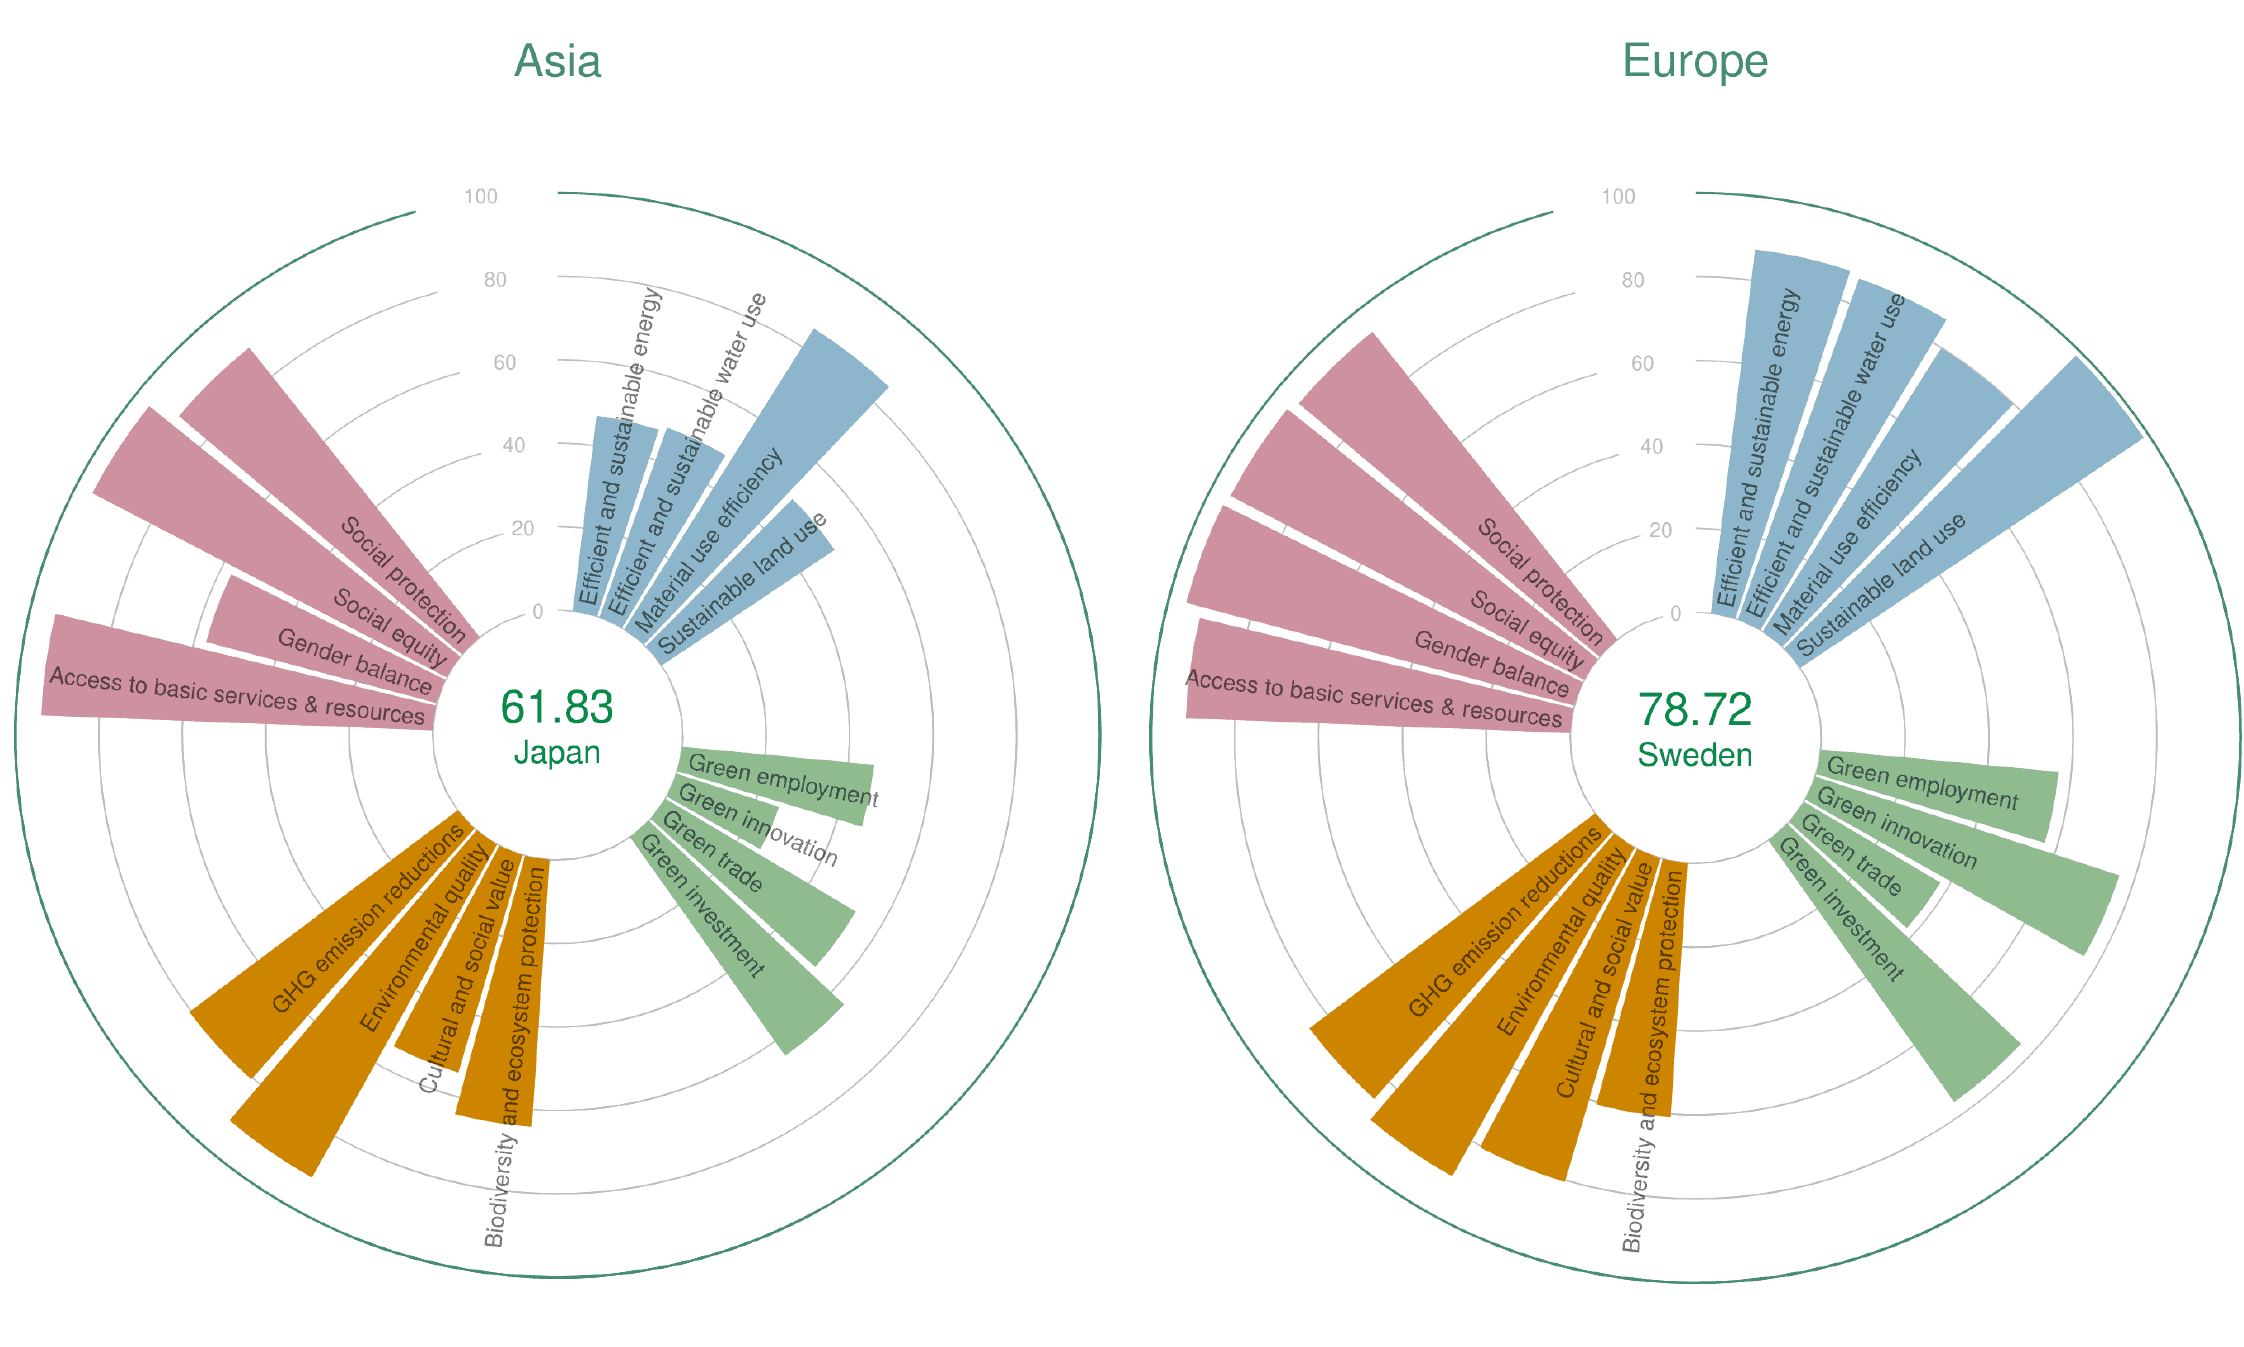
Sweden has a good green growth performance as it progresses
very close to achieving all of its targets in the social inclusion
pillar, reflected by a dimension score of 94.06. This makes Sweden
the global top performer for this dimension, followed by the
Netherlands with 92.51, then Denmark with 92.33 (Table 17).
Sweden has also made significant improvements in almost reaching
its target in sustainable land use by decreasing trends in its fertilizer
application to reduce nutrient surpluses, thus improving soil quality
(OECD, 2019c).
Japan has almost reached its targets for social equity and access to
basic services with scores of 95.72 and 93.84, respectively (Table 17). The progress in social inclusion indicators has been achieved
as the country promotes social welfare, primarily due to its aging
population (ADB, 2012). However, in comparison to other top
countries, Japan scores the lowest in gender balance, requiring
continued work in improving workplace culture and early education
to promote equality for women (Estévez-Abe, 2013). Japan is also
on track to meet environmental quality and GHG emission reduction
targets.
Mexico has nearly reached its target for material use efficiency.
Other notable progress is also observed in the social inclusion
pillar and natural capital protection, but with slight lags in both
access to basic services and biodiversity and ecosystem protection,
respectively. Mexico has also scored moderately in terms of green
investment, as it is crucial to the economy to develop climateresilient
infrastructure due to the natural vulnerability of the country
to climate-related disasters (Holmes, Orozco, & Paniagua Borrego,
2017).
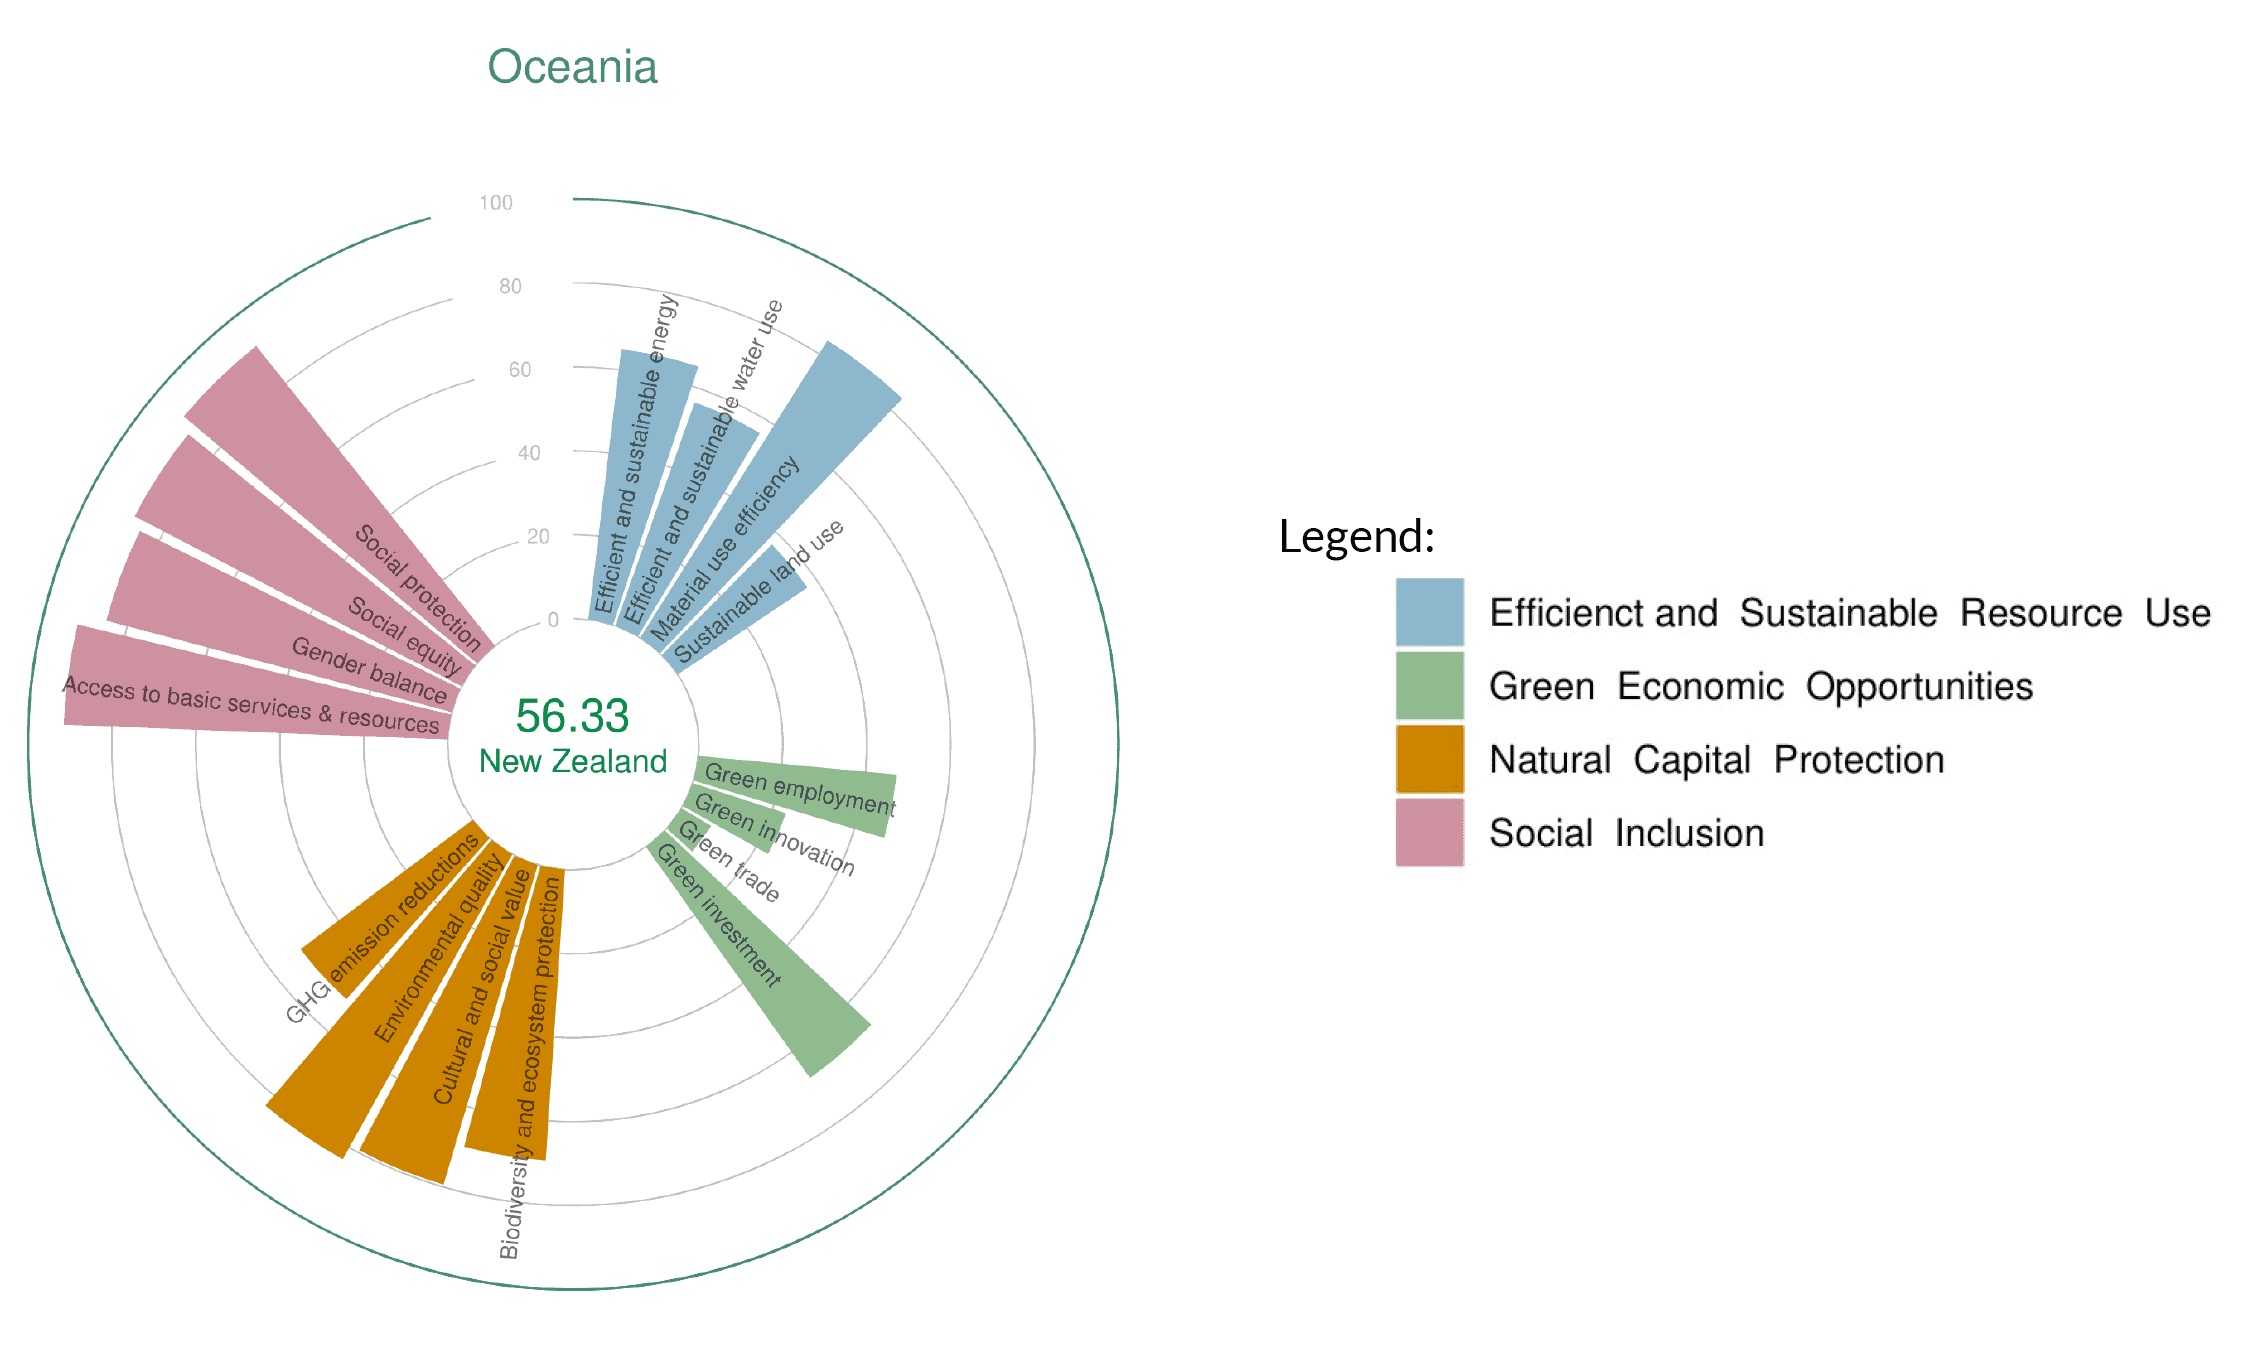
New Zealand continues to have good green growth performance in
the region, previously being the top performing country in Oceania
in 2019, as its current score increased in score from 52.17 to 56.33
(Acosta et al., 2019a). The social inclusion target is nearly achieved
across all indicators, highlighting New Zealand’s priority in equal
opportunities within social policy. The progress in the natural capital
protection shows that the country is on track to meet the targets
on cultural and social value and environmental quality, although
the scores for biodiversity and ecosystem protection and GHG
emissions reductions are moderate. With nearly half of all New
Zealand’s emissions coming from agriculture, this reflects the low
scores observed in sustainable land use as a signal of New Zealand’s
current agricultural practices (Carroll & Daigneault, 2019).
Tanzania has nearly reached its target for gender balance, as its
strongest performing indicator in the social inclusion pillar. Tanzania
has also performed well in efficient and sustainable energy and
material use efficiency categories and has the second highest score
for green investment among these top countries in other regions. As
a result of embarking on large-scale, the public-private partnerships
are established such as the Southern Agricultural Growth Corridor
of Tanzania initiative which aims to mobilize 3.5 billion USD in
investments by 2030 to help the African country transition to a
green economy (Buseth, 2017).