Green Growth Index:
Introduction
- Introduction
- Global Review
- Regional Outlook
- Country Performance
- Expert Consultations
- Ongoing applications and collaborations
- Statistical Tables
- Appendix 1 Summary of methods for the Green Growth Index
- Appendix 2 The international expert group
- Appendix 3 List of expert reviewers
- Appendix 4 The GGPM Team
- Partners
1.1 About the Green Growth
Index
Green Growth Index is a composite index measuring a country’s performance in achieving sustainability targets including Sustainable Development Goals (SDGs), Paris Climate Agreement, and Aichi Biodiversity Targets for four green growth dimensions – efficient and sustainable resource use, natural capital protection, green economic opportunities, and social inclusion (Acosta et al., 2019a). The Index is the first metric for green growth that explicitly links to sustainable development. In order to make the Index relevant at the national and international level, it has been imperative for GGGI to align the Index with global sustainability goals and targets. This complementary set of internationally accepted targets and related indicators serves as a reliable reference for the Green Growth Index and allows governments to align their pathway to green growth with achieving the SDGs and national climate and biodiversity goals (Acosta et al., 2019b).
The four dimensions of green growth are closely interlinked (Figure
1). Using natural resources efficiently and sustainably will produce
more goods and services with less resources. It will protect natural
capital including water, energy, land, and materials as well as the
ecosystem services they provide. A healthy ecosystem characterized
by, for example, fertile soil, multifunctional forests, productive land
and seas, good quality freshwater and clean air, and pollination
increases economic productivity and creates new economic
opportunities. Green Growth advocates the protection of natural
capital because it provides sources of economic growth such as
green jobs, trade, and investment. And it emphasizes not only people
benefitting from growth but also people contributing to the efficient
use and protection of natural resources. This makes social inclusion
a key mechanism to both achievement and distribution of gains from
green growth. 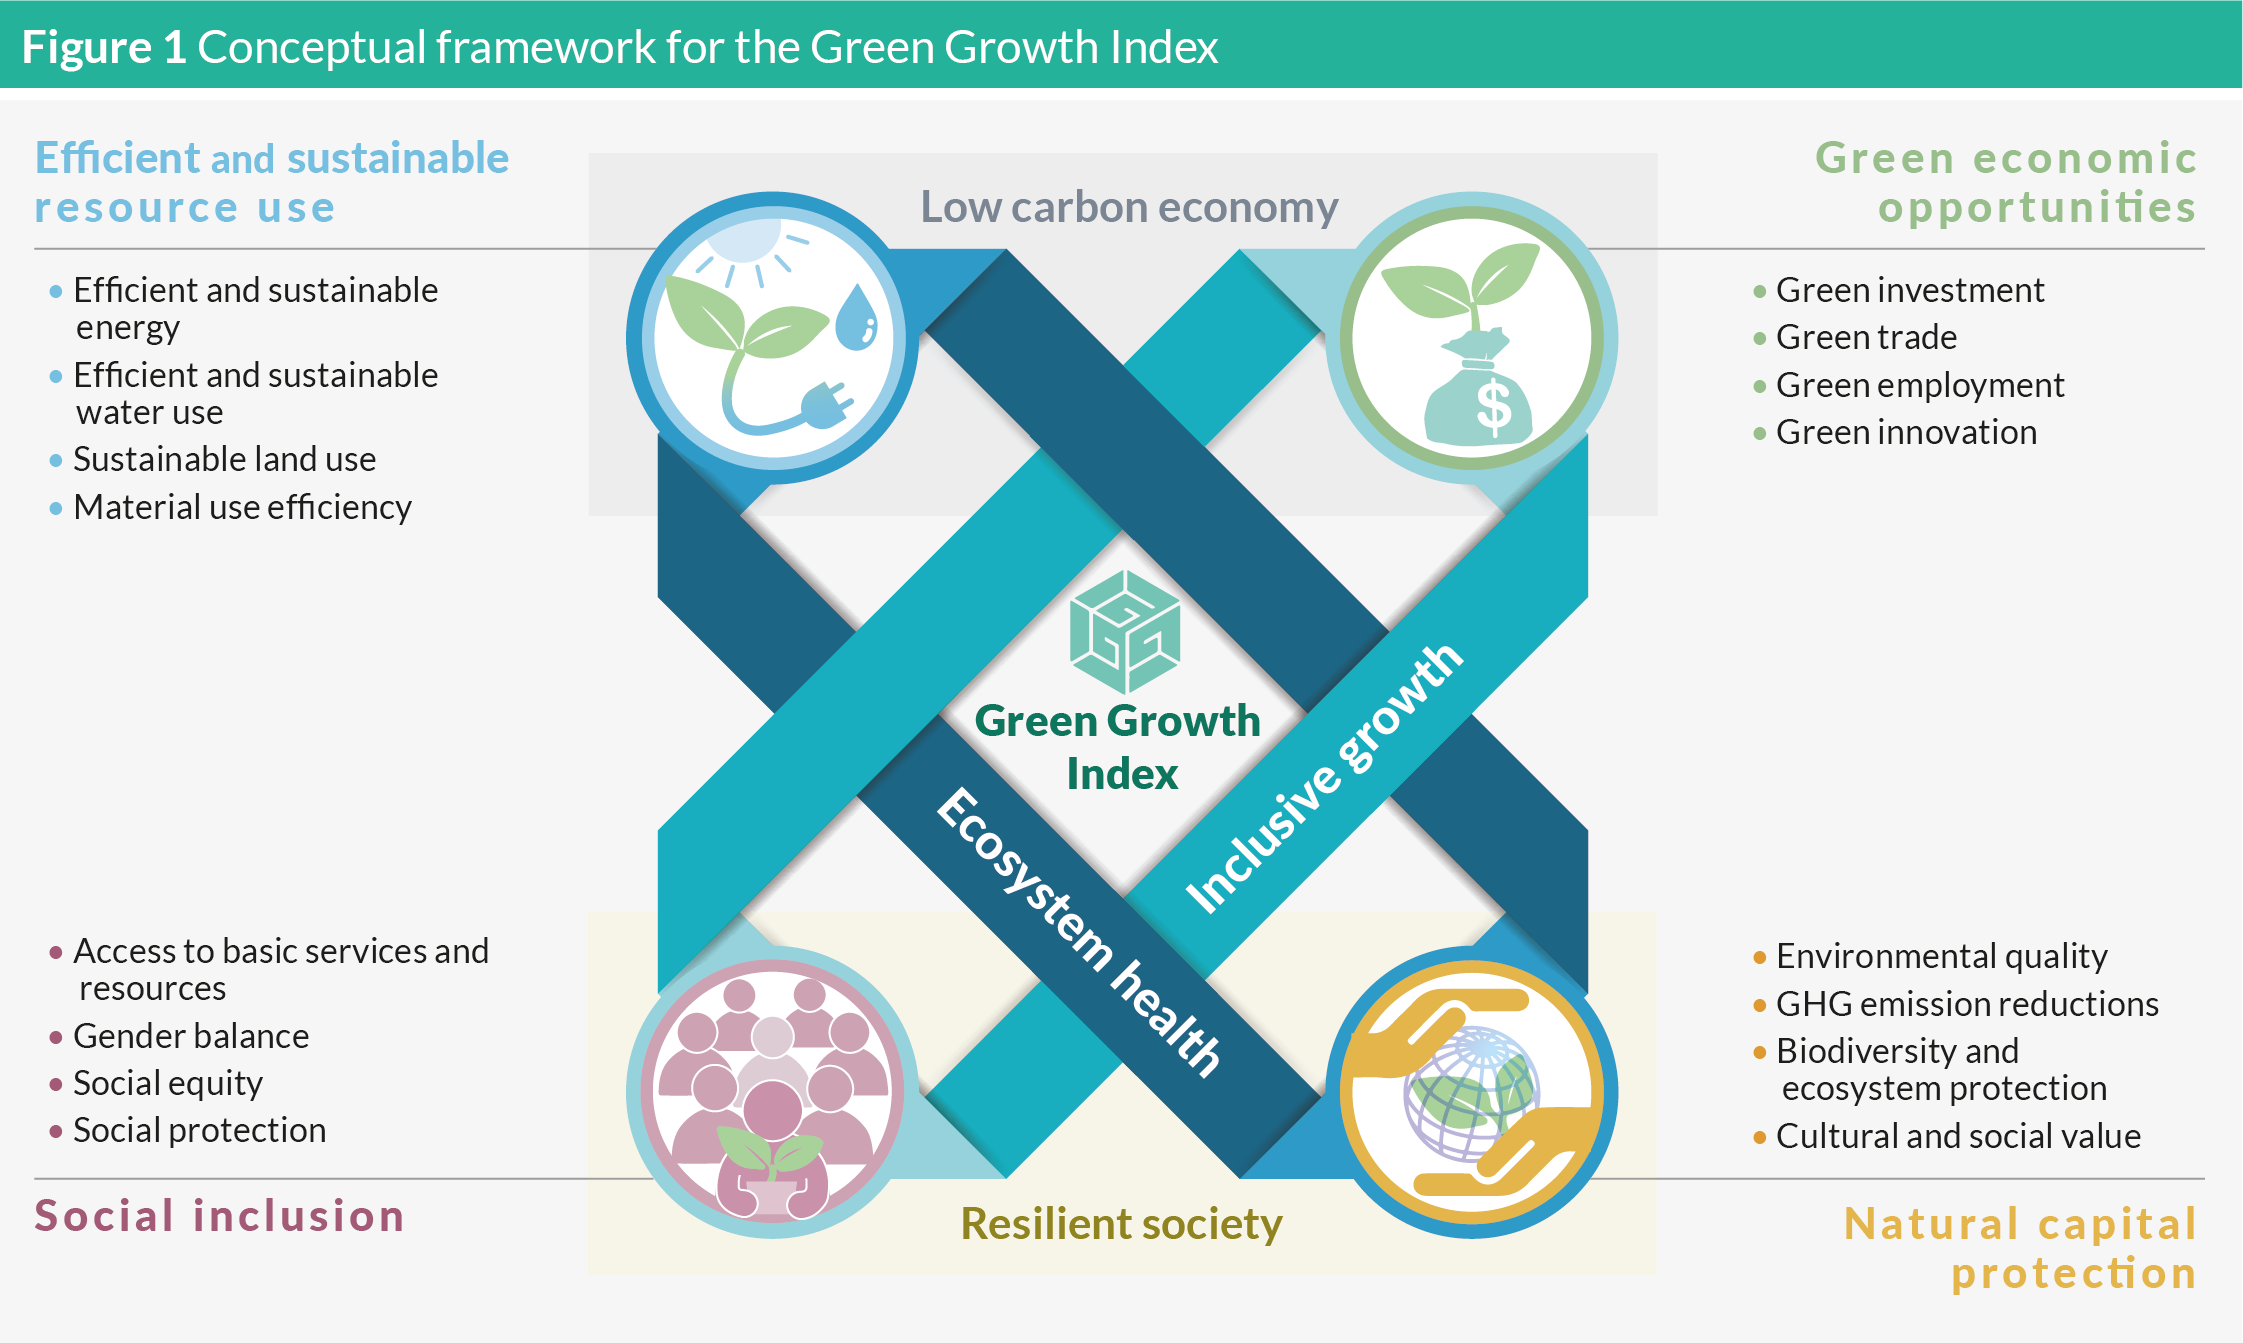
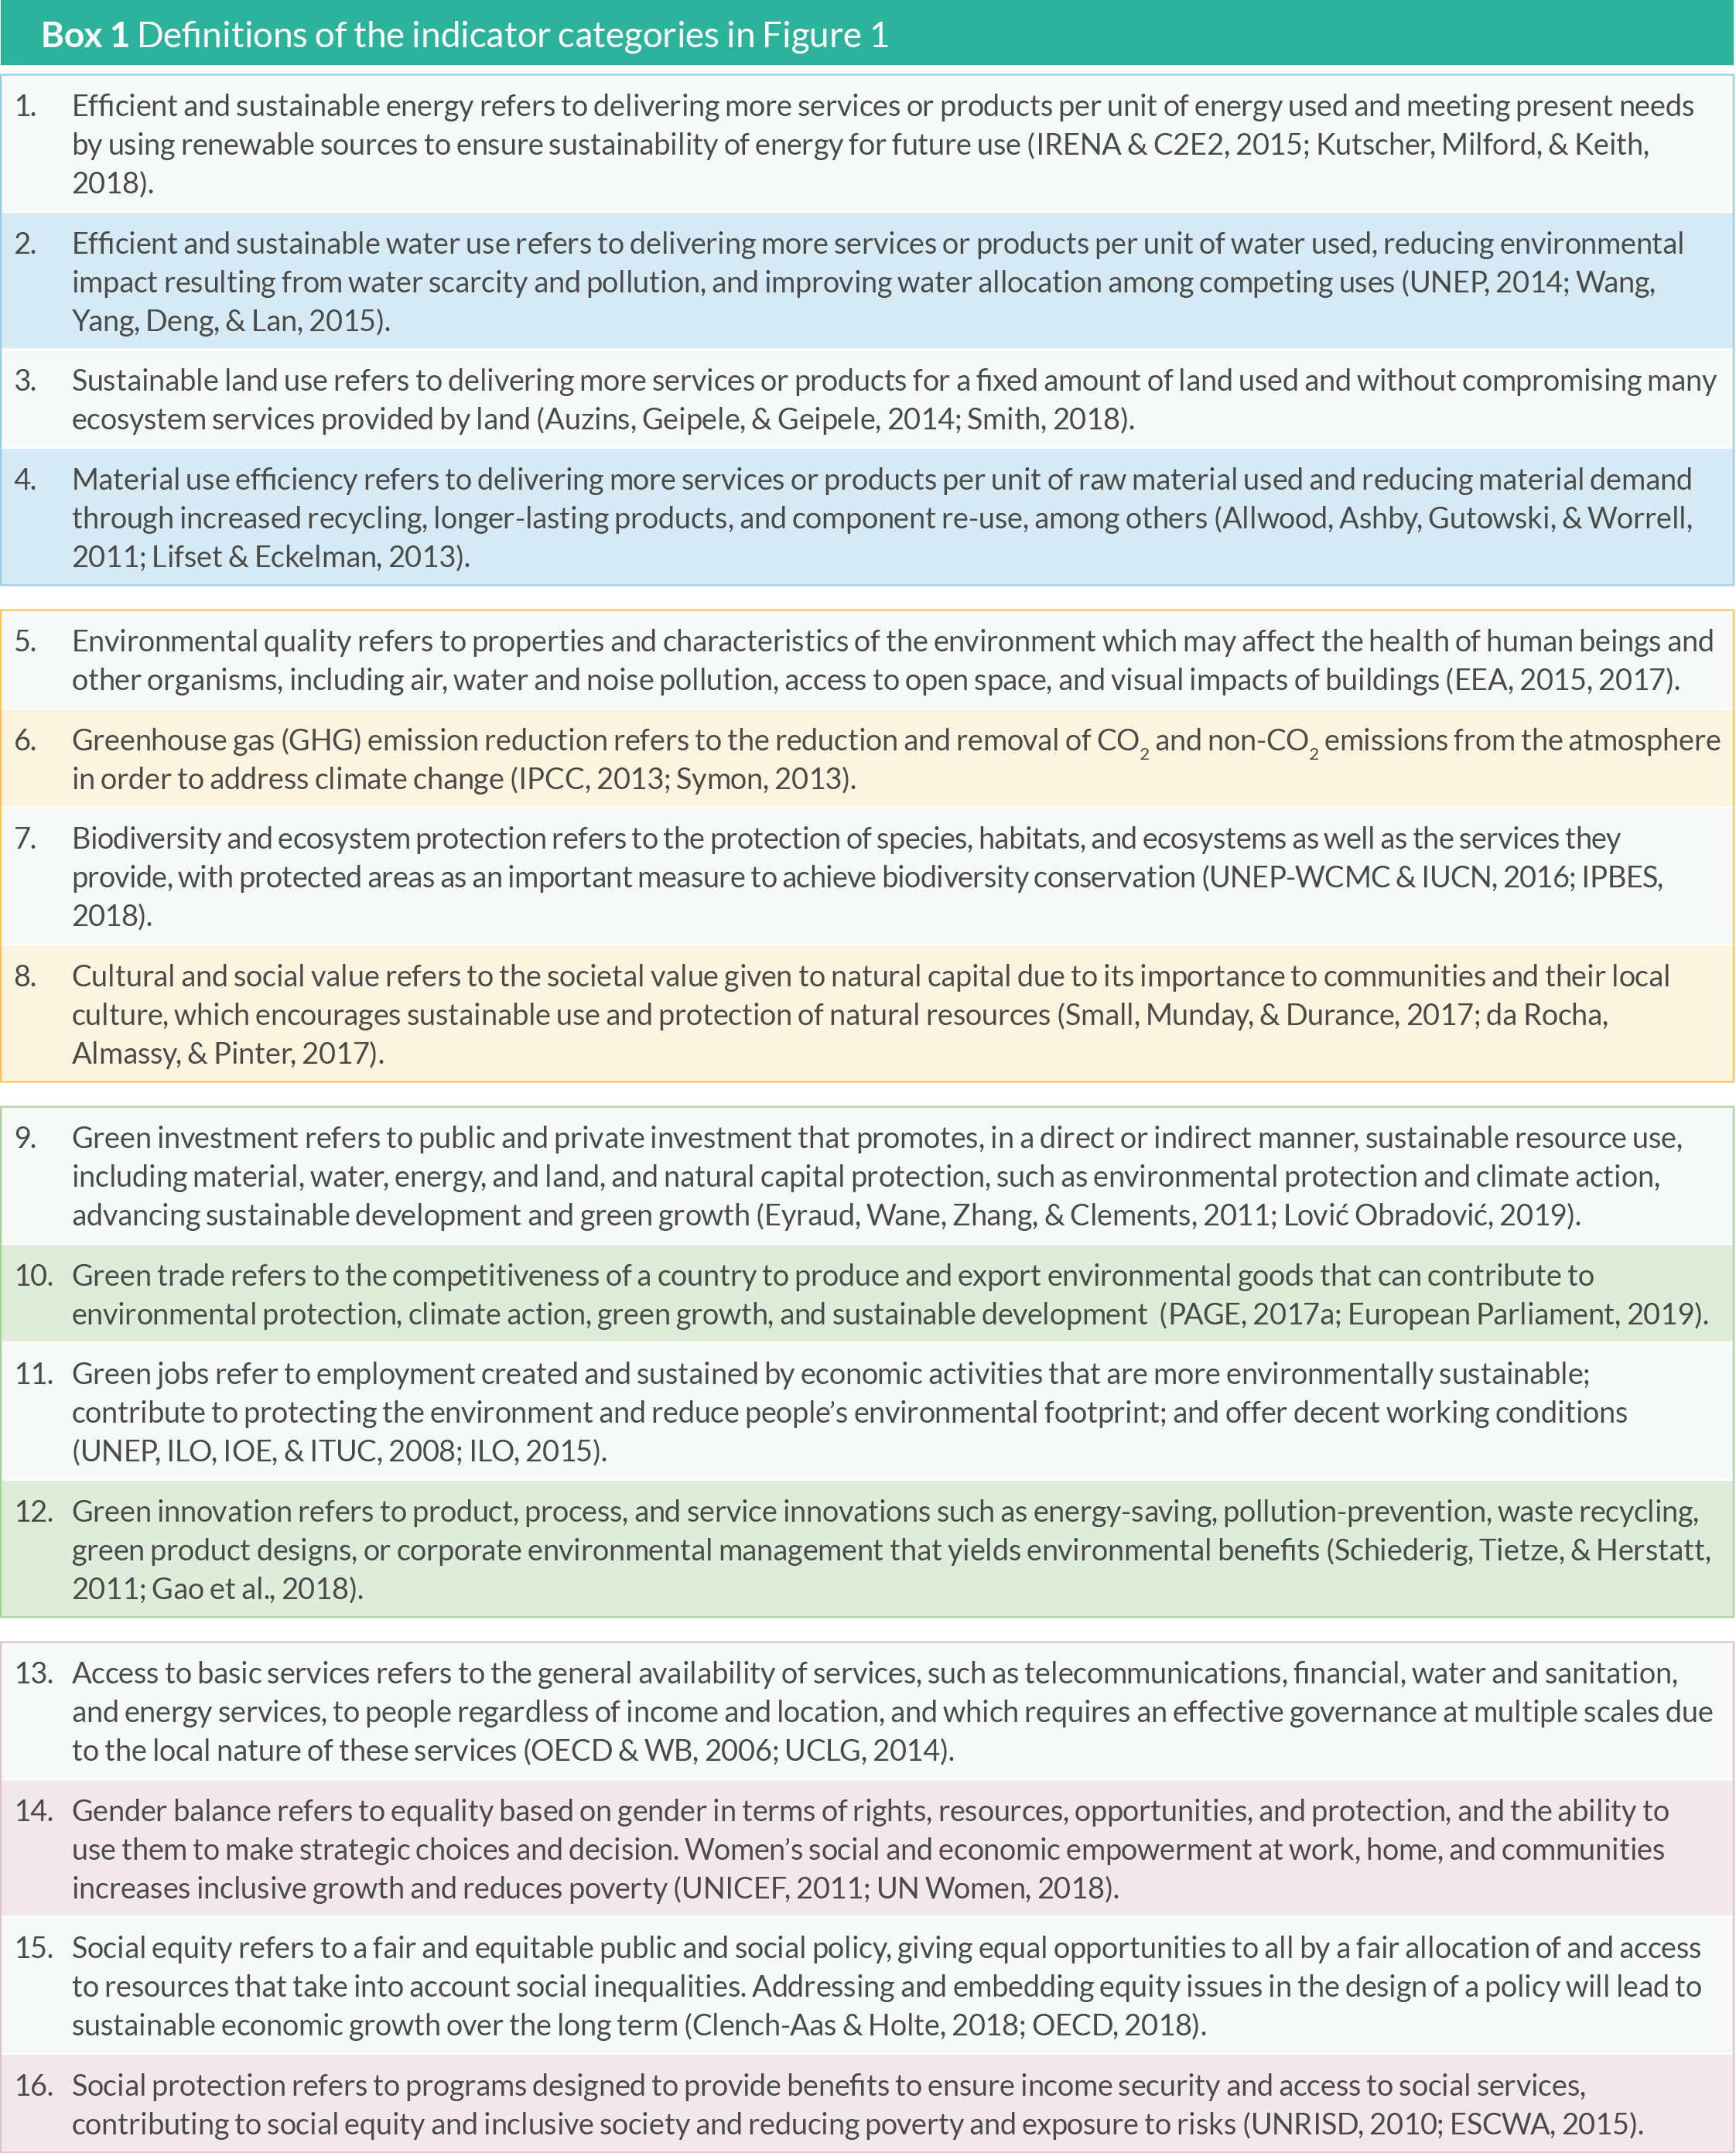
The interlinkages among the four green growth dimensions were drawn from the concepts of low carbon economy, resilient society, ecosystem health, and inclusive growth (details are available in Acosta et al., 2019a). These concepts guided the determination of four indicator categories that represent each dimension. They can be interpreted as “pillars” of green growth, forming the basis for transition to efficient and sustainable resource use, enhancement of natural capital protection, creation of green economic opportunities, and enablement of social inclusion. Box 1 presents the definitions of the indicator categories.
The scores for the Green Growth Index range from 1 to 100, with
1 having the lowest or very low performance and 100 having the
highest or very high performance. Because the indicators are
benchmarked against sustainability targets (see Chapter 1.2.3 Link
to the SDGs), a score of 100 on the index, dimensions, and indicator
categories means that a country has reached a given target. The
scores are classified in a given range and can be interpreted as
follows:
• 80–100 are very high scores, having reached or almost
reached the target.
• 60–80 are high scores, taking a strategic position to
completely reach the target.
• 40–60 are moderate scores, finding the right balance to
move forward to and avoid moving away from the target.
• 20–40 are low scores, identifying the right policies to align
development toward achieving the target.
• 1–20 are very low scores, requiring significant actions to
improve position relative to the target.
1.2 Updates in the 2020 Green Growth Index
1.2.1 Main improvements
First published in 2019, GGGI has envisaged to annually review
the Green Growth Index to continuously improve its relevance to
policy and decision making. There are two main improvements in the
Index this year: first is the computation of trend from 2005 to 2019,
and second is the replacement of several proxy variables with more
relevant indicators or better data availability. The motivations for
these are as follows:
1. Motive 1: The availability of other indicators with improved
country coverage from the UNSTATS SDG database.
2. Motive 2: The inclusion of new indicators which are
currently being suggested to be part of the UNSTATS SDG
database.
3. Motive 3: The exclusion of indicators for which time-series
data are not available and its availability is not expected to
change in the near future.
4. Motive 4: The rescaling/redefining of indicators for which
time-series data show erratic trend over time.
5. Motive 5: The creation of interlinkages between the
Simulation Tool and Green Growth Index which requires
adjustment in definition and unit of the indicators.
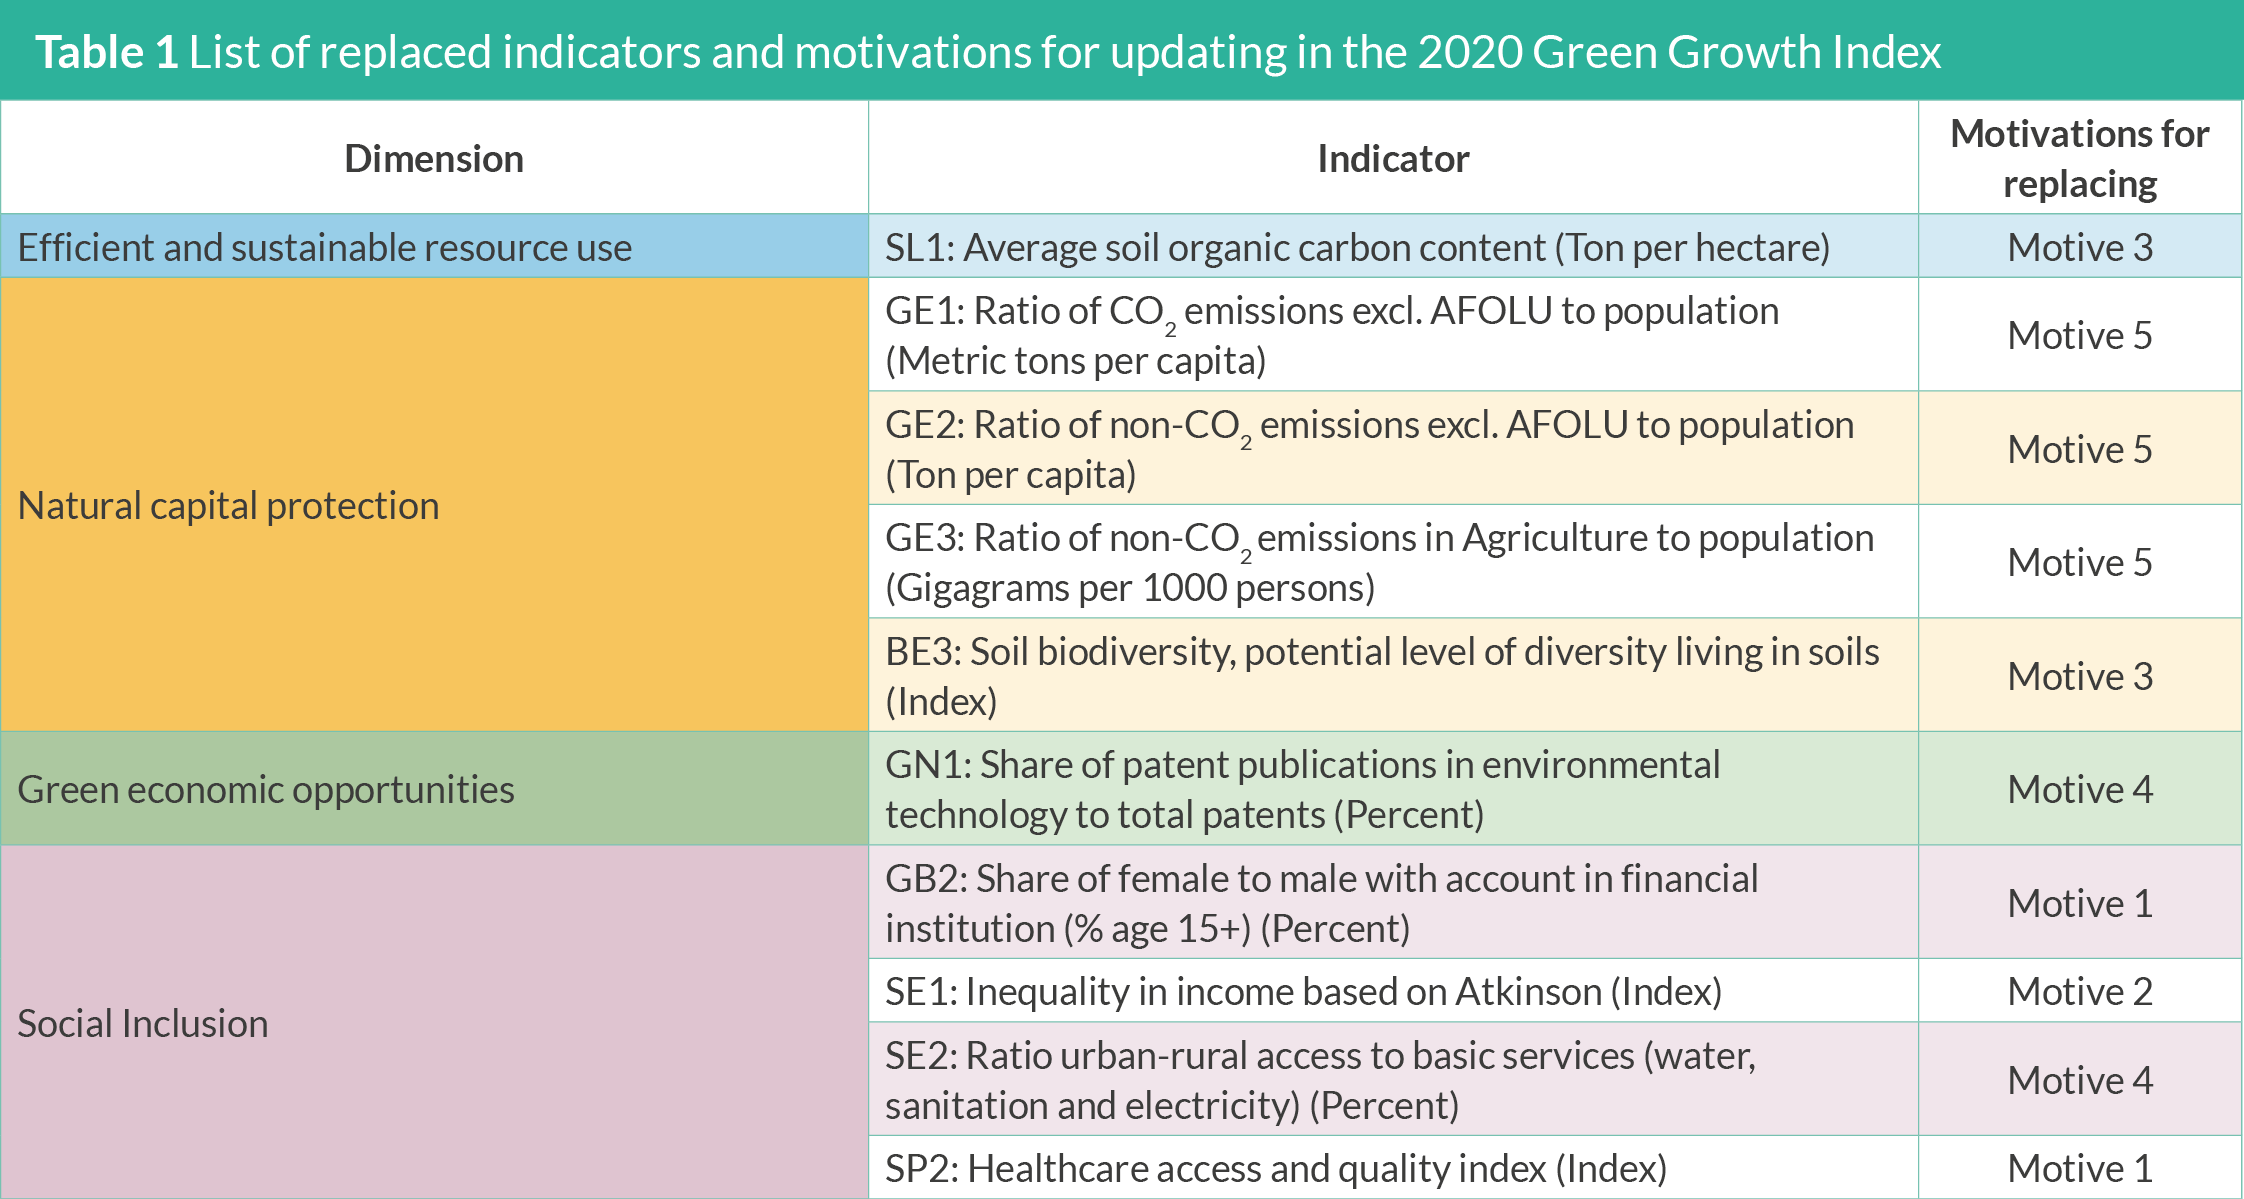
Table 1 presents the 10 indicators which have been updated in
the 2020 Green Growth Index, including mainly indicators from
natural capital protection and social inclusion. The motivations
were almost equally important for the different indicators, except
for Motive 2 which is relevant only for SE1: Inequality in income
based on Atkinson (Index). This indicator, which was accessed
from the United Nations Development Programme (UNDP)
database last year, is no longer available for download this year.
More importantly, there are ongoing debates on the inclusion
of Palma Ratio as a measure of income inequality in the SDG 10
(IISD, 2019). The income inequality indicator based on Atkinson
Index was thus replaced with Palma Ratio, which is the ratio of
the top 10% to the bottom 40% share of gross national income
and measures shifts at the ends of these distributions (Fukuda-
Parr, 2019). Among the indicator categories, the GHG emissions
reduction (GE) has the highest number of updated indicators, but
motivations were mainly to align units of measurement for linking
to the Simulation Tool (Acosta et al. 2020).
1.2.2 Updated indicator framework
The new indicators have been validated and confirmed by 110
experts from 54 countries (11 countries in Africa, 16 in Asia, 10
in the Americas, 13 in Europe, 4 in Oceania) with representations
from GGGI, international expert group, scientific community,
policymakers, and non-government organizations (NGOs) (Figure
2), through online expert consultations (see Chapter 5 Expert
consultations). While NGOs appear to be underrepresented, six
(21%) of the members of the international expert group are also
from NGOs, increasing the total number of experts to 12 out of 110
(Figure 2). In 2018, the Green Growth Performance Measurement
(GGPM) team formed the international expert group to continuously
support the development of the Green Growth Index. Many experts
in this group are also members of the Green Growth Knowledge
Partnership (GGKP) Metrics and Indicators Working Group.
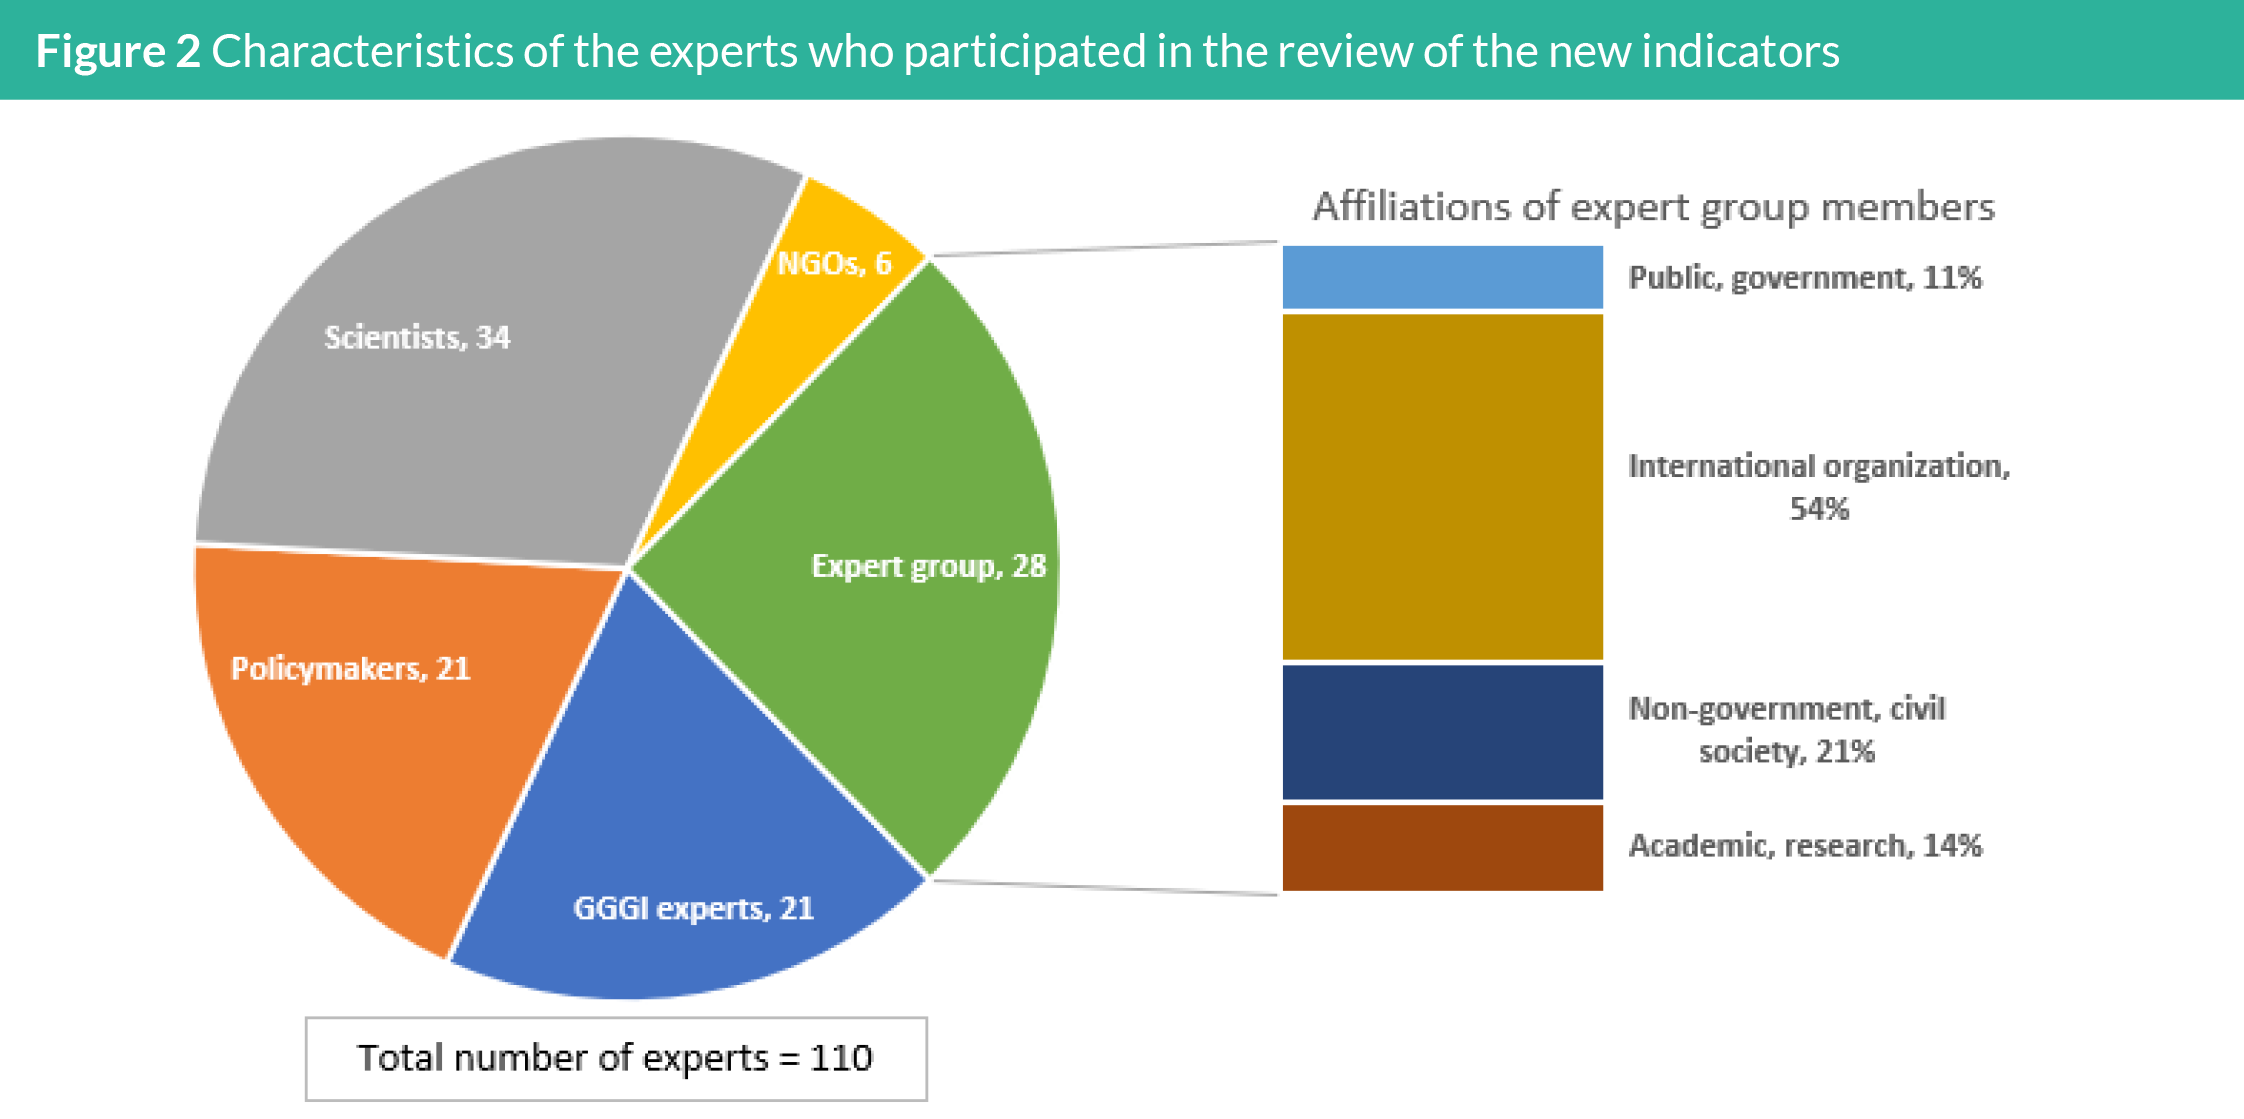
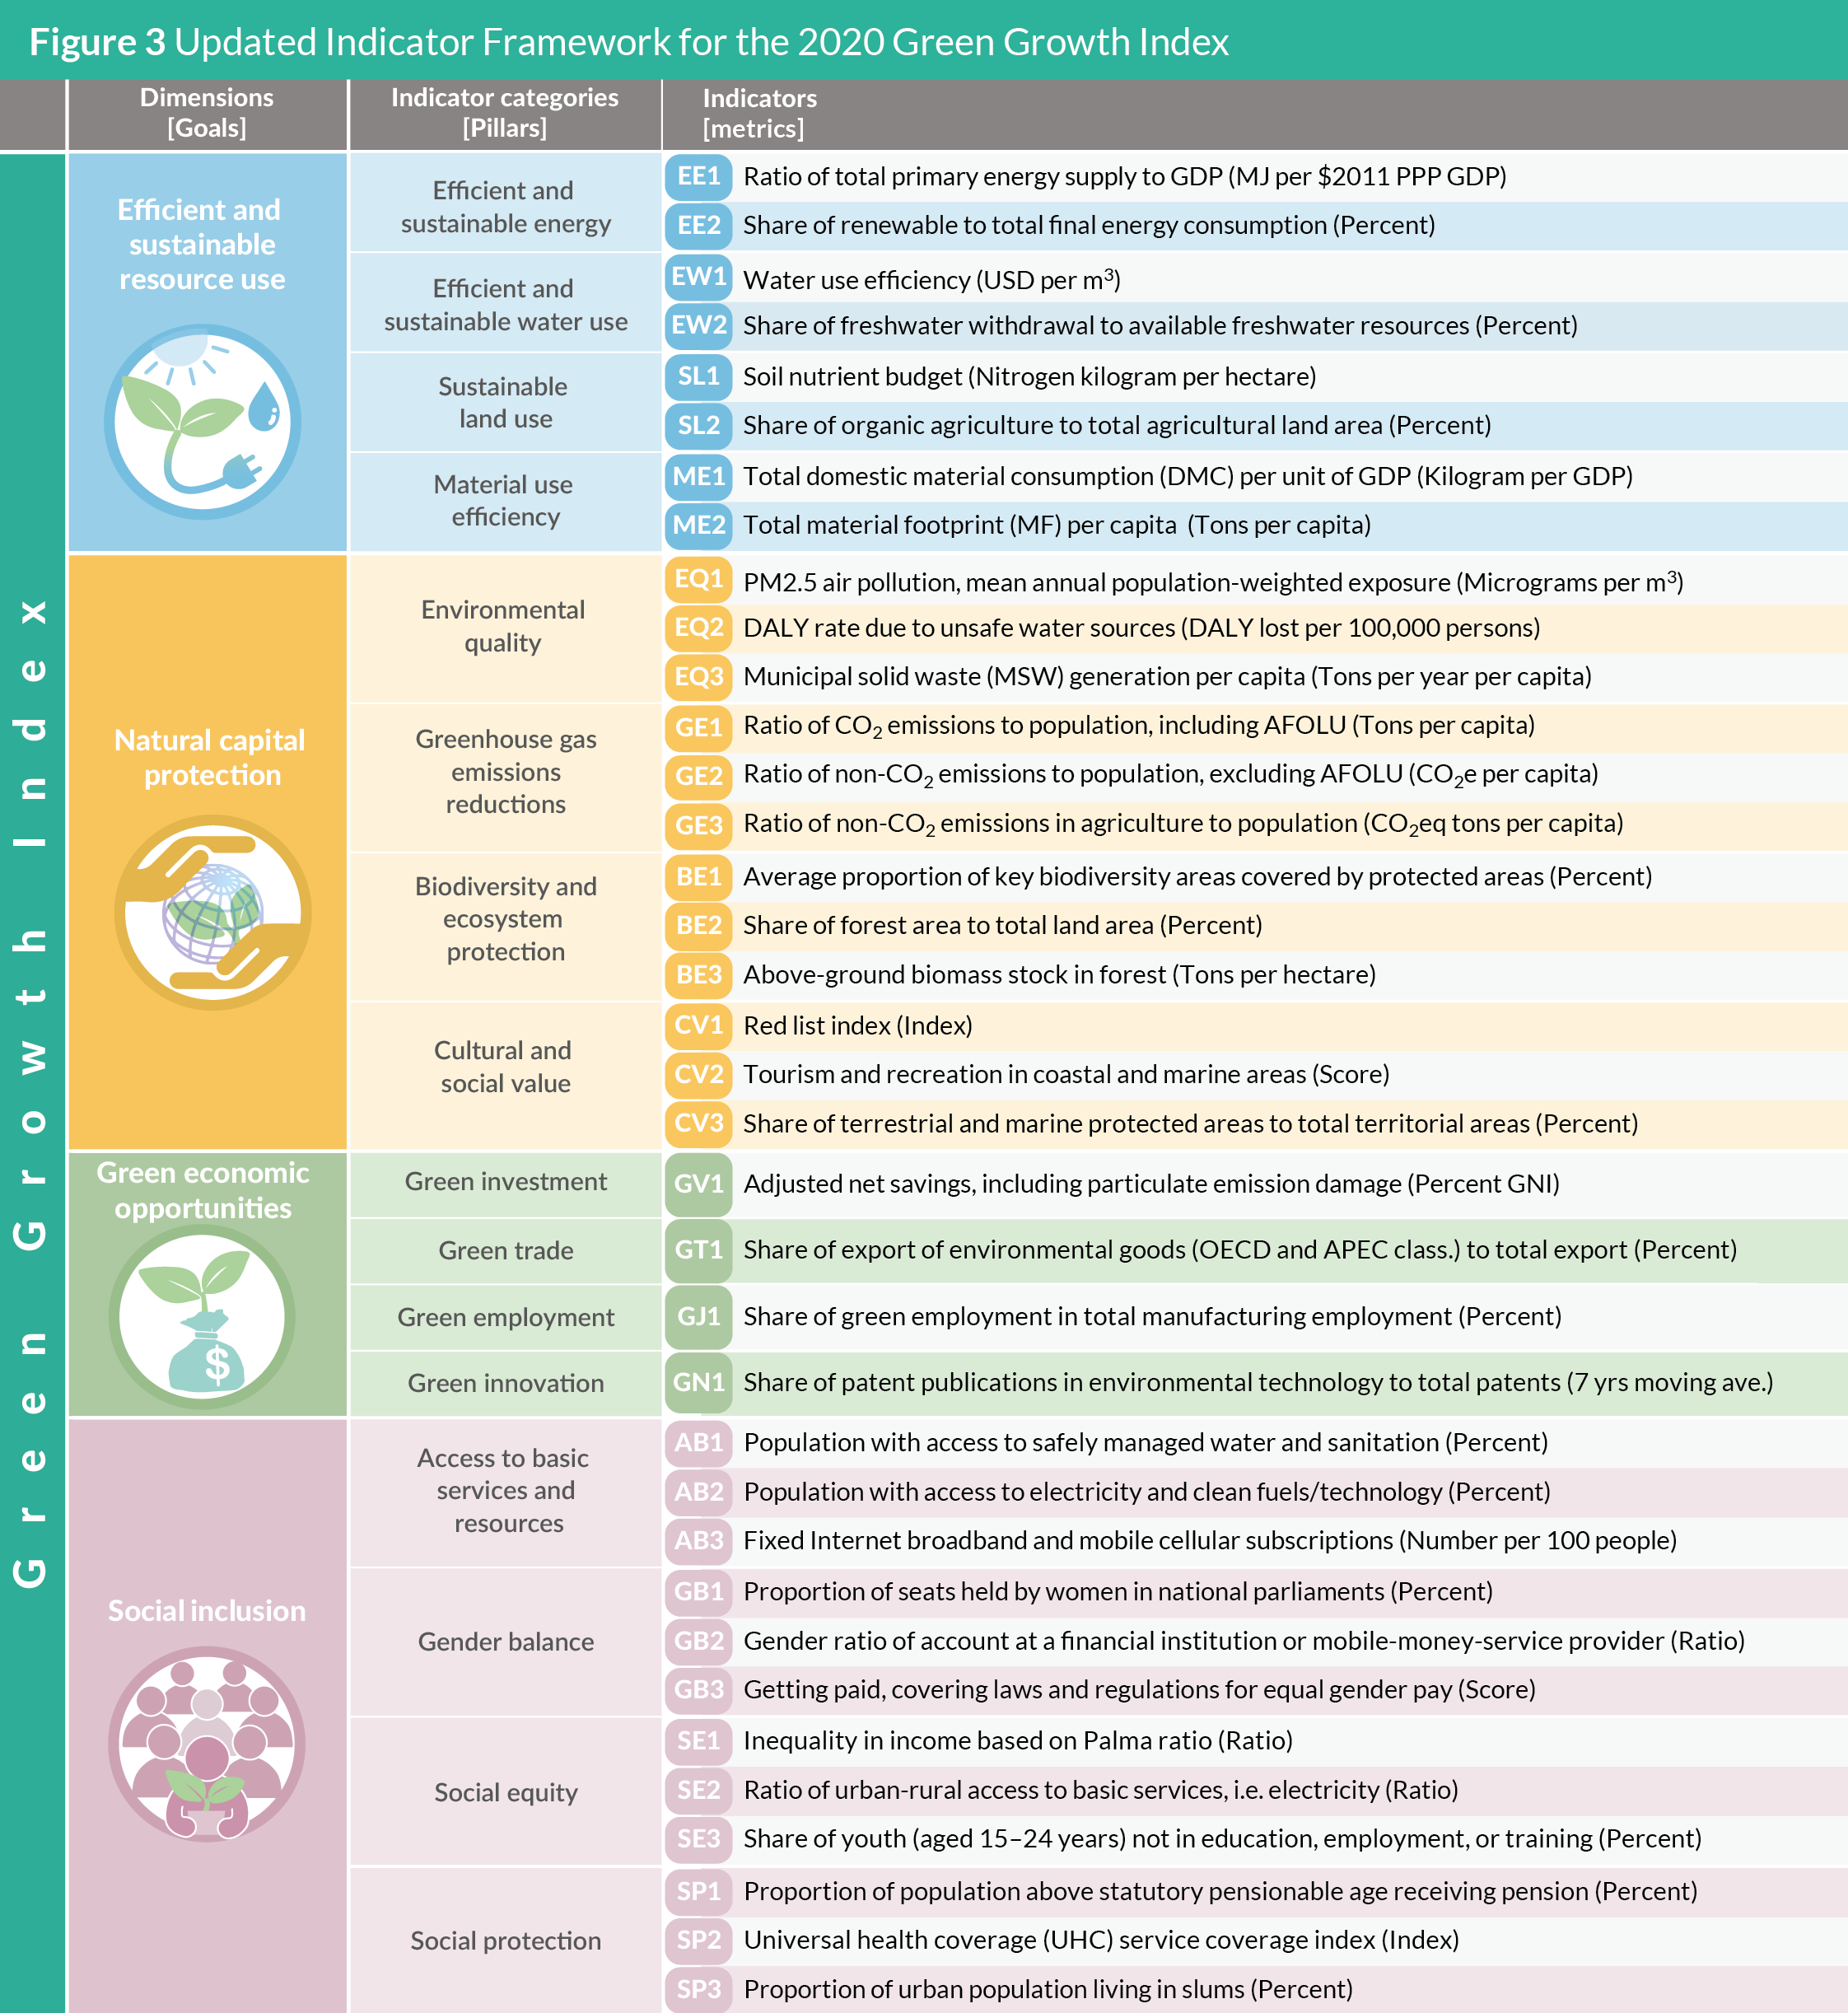
Figure 3 presents the updated indicator framework with the new
green growth indicators for the 2020 Green Growth Index. The
new indicator for SL1 is biological fixation, cropland nutrient flow
per unit area, which has time-series data from 1961 to 2018. It
was published by the FAO and, as of December 2020, available
for download from the FAOSTAT database. It replaced the average
soil organic carbon content which data was available only for
2019. This new indicator, also referred to as biological nitrogen
fixation, is considered as an alternative sustainable practice for
soil management to reduce the harmful impacts of overusing
inorganic and manure fertilizers on ecosystems (Mohammadi,
Sohrabi, Heidari, Khalesro, & Majidi, 2012; Soumare et al., 2020).
These include, among others, pollution of groundwater, increased
atmospheric nitrous oxide (N2O), and influence of global carbon
cycles from direct use of nitrogen fertilizer as well as carbon
dioxide (CO2) emissions from producing nitrogen fertilizer (He et
al., 2016; Montañez, 2000). The new indicator for BE3 is aboveground
biomass stock in forest in tons per hectare, which was
developed by FAO and is one of the SDG indicators for sustainable
forest management (SDG 15.2.1). Like the previous indicator for
SL1, the previous indicator for BE3 has also limited time-series
data, only for 2016 and 2019. The new indicator has data for
2000, 2010, and 2015-2020. An increase in above-ground biomass
indicates gains in biomass due to forest growth, while a decrease
indicates losses in biomass due to deforestation, forest fires, pest,
and diseases, etc. (UNSTATS, 2020a). Maintaining species diversity
has a positive impact on above-ground biomass (Li, Su, Lang, Liu,
& Ou, 2018; Pokhrel & Sherpa, 2020) and the same is the case for
forest restoration (Damptey, Birkhofer, Nsiah, & de la Riva, 2020).
The time-series data for the previous indicators for GN1 and SE2
showed an erratic trend, which had significant impacts on the
stability of the Index trend. In the case of GN1, annual changes on
the share of patent publications in environmental technology to total
patents were erratic because countries were not able to publish
patents every year, causing spikes in years when they were able to do
so. Moreover, when no patent was published in a given year, although
several were published in the past years, it directly implied that the
country lacks innovation capacity. This may not make sense when
considering innovation capacity over time because the patents which
were published in previous years (and which continue contributing
to greening the economy) are ignored. Several experts suggested
using a moving average instead of a cumulative share of patent
publications in environmental technology to total patents. With
regards to SE2, the spikes in the trend in the ratio of urban-rural
access to basic services were caused by the data paucity on urban
and rural access to safely managed drinking water and sanitation.
Consequently, these indicators were excluded from SE2 indicator for
this year and until data availability improves in the next years. The
SE2 only consists of urban-rural share in access to electricity in the
2020 Green Growth Index.
Finally, the indicators for GB2 and SP2 were replaced with similar
indicators that were recently included in the UNSTATS SDG
database, SDG Indicators 8.10.2 and 3.8.1, respectively. For
the new indicator for GB2, mobile-money-service provider was
added with account at a financial institution. Combining these
two indicators enhanced the measurement of financial inclusion
because mobile money provides account ownership and payment
services to people in remote and underserved areas in developing
and emerging countries (Hamdan, 2019; Navis, 2019). The new
indicator for SP2 is a composite index of 14 indicators covering
four categories: reproductive, maternal, newborn, and child health;
infectious diseases; non-communicable diseases; and service
capacity and access (UNSTATS, 2020b). Currently, there are over
100 low- and middle-income countries that are working hard to
achieve universal health coverage (UNDP, 2019b). Thus, this will
improve inclusion in health services.
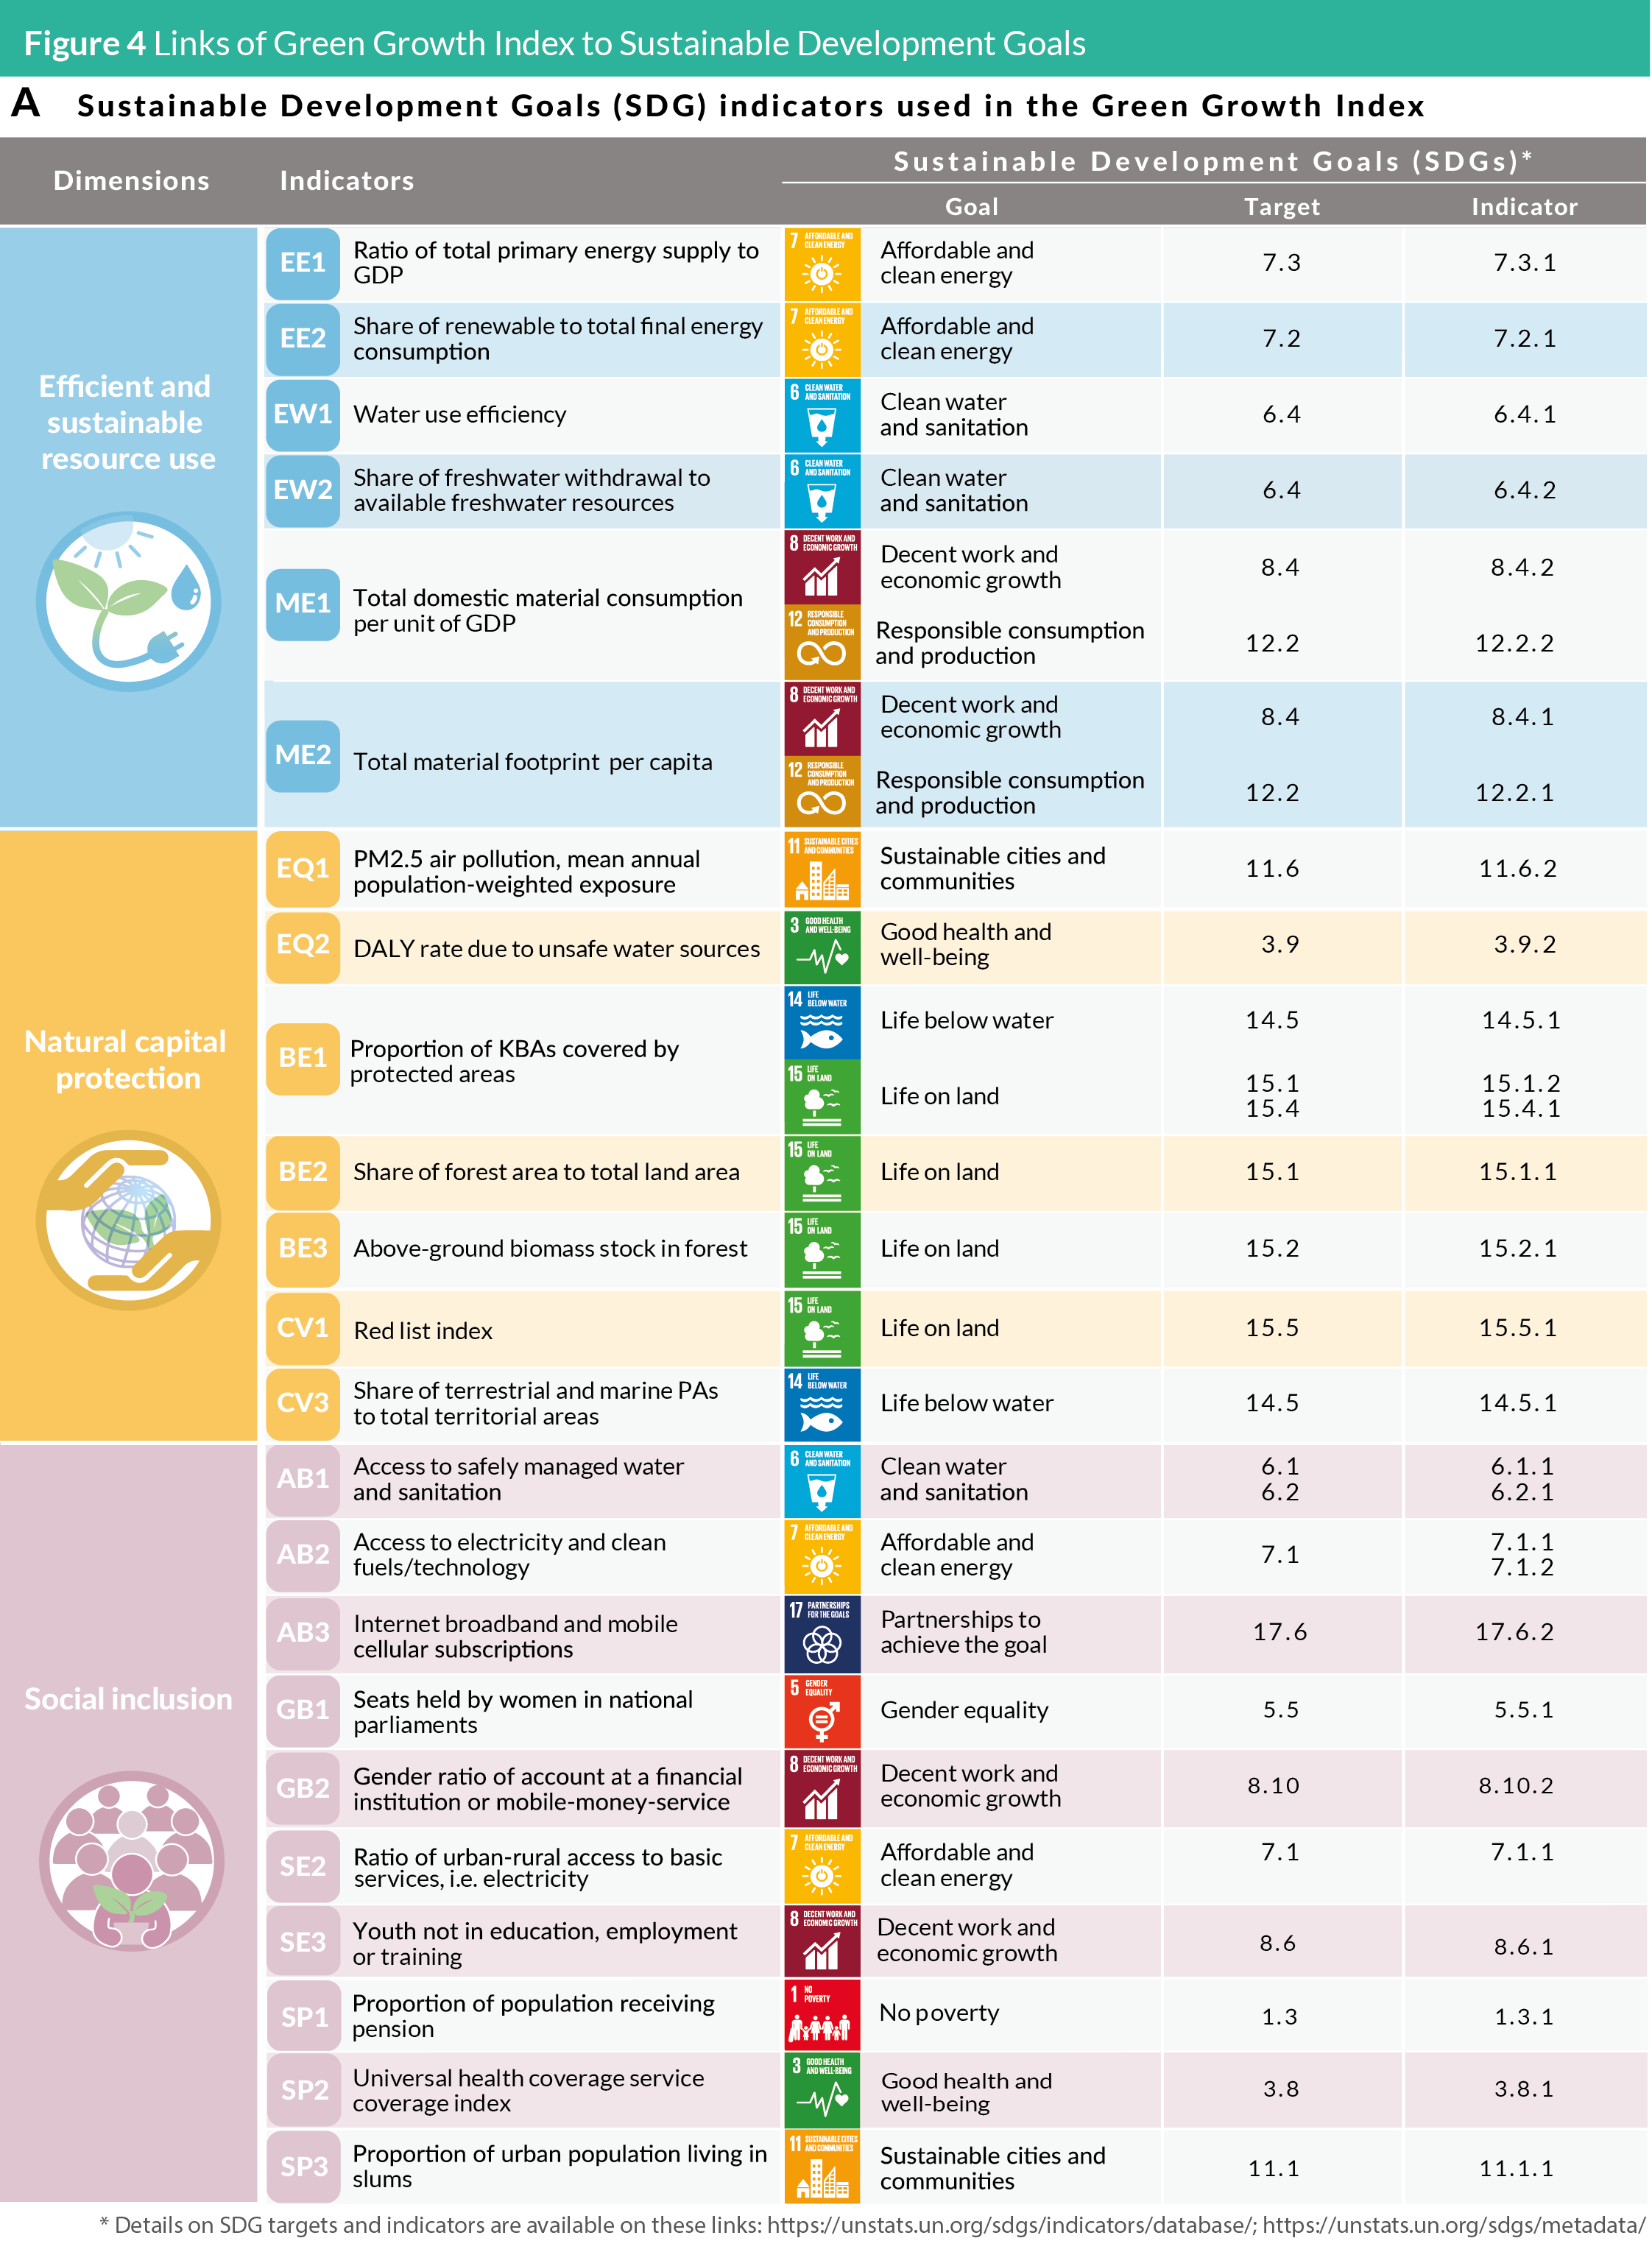
1.2.3 Link to the SDGs
The updated indicator framework for the 2020 Green Growth Index
has two additional SDG indicators – BE3: Above-ground biomass
stock in forest for Goal 15 on life on land and SP2: Universal health
coverage (UHC) service coverage index for Goal 3 on good health
and well-being. With these, the Green Growth Index now covers
27 SDG Targets, which are represented in 23 indicators (Figure
4A). Two of these 23 indicators are either included in different SDG
Targets as in the case of ME1: Total domestic material consumption
per gross domestic product (GDP) and ME2: Total material footprint
per capita, which are both in Goal 8 on decent work and economic
growth and Goal 12 on responsible consumption and production.
The other three indicators are composite of different SDG
indicators:
• BE1: Proportion of Key Biodiversity Areas (KBAs) covered
by protected areas, which combines marine (SDG 14.5.1),
freshwater and terrestrial (SDG 15.1.2), and mountain (SDG
15.4.1) biodiversity
• AB1: Access to safely managed water and sanitation, which
covers both drinking water (SDG 6.1.1) and sanitation (SDG
6.2.1) services
• AB2: Access to electricity and clean fuels/technology, which
combines access to electricity (SDG 7.1.1) and primary
reliance on clean fuels and technology (SDG 7.1.2)
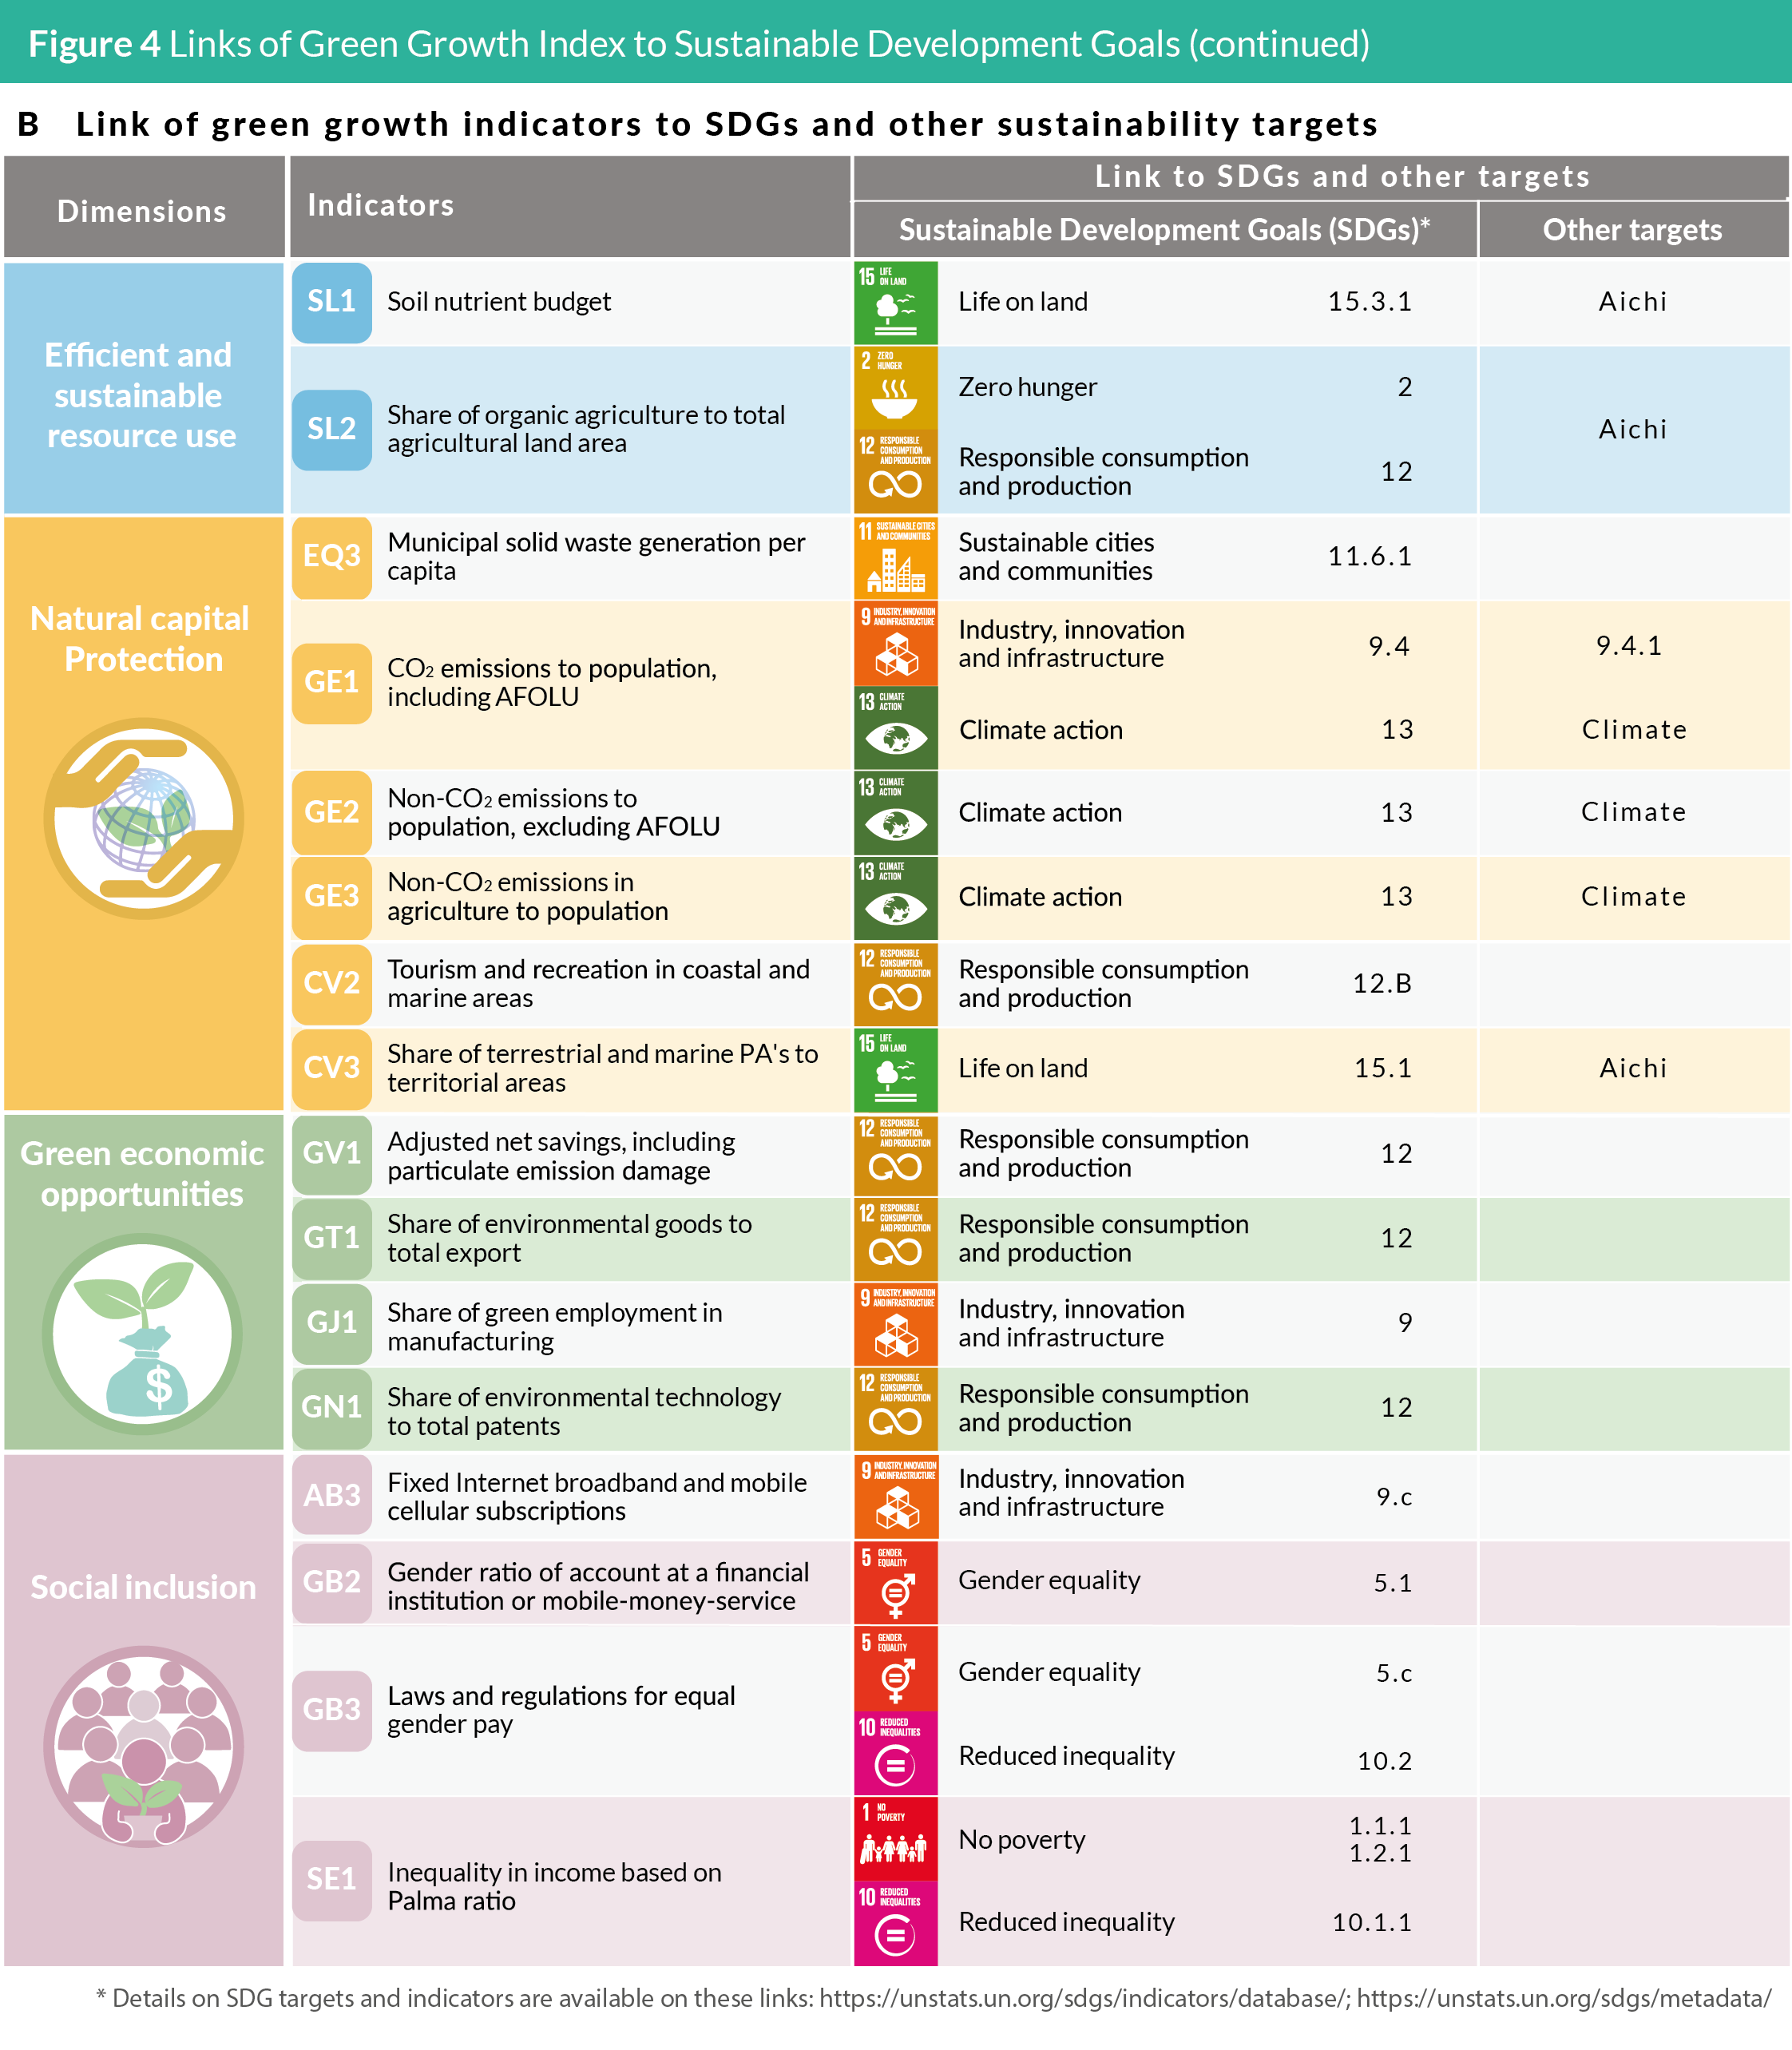
But still, 15 indicators are not SDG indicators and thus do not
have SDG Targets (Figure 4B). Except for CV3: Share of terrestrial
protected areas to total territorial areas, which has Aichi Biodiversity
Target, other indicators do not have specific global targets at present.
Even for the indicators on GHG emissions reduction, there are no
globally agreed climate targets. National targets are determined by
governments in their National Determined Contributions (NDCs).
Global targets are necessary to benchmark countries’ performance
against the same measurement.
To come up with sustainability targets for all the green growth
indicators, the following criteria were adopted:
1. For SDG indicators, the SDG targets, both explicit and
implicit, which were suggested in the Organisation for
Economic Co-operation and Development (OECD, 2019a,
2019b) and UN Sustainable Development Solutions
Network (SDSN) (Lafortune et al., 2018; Sachs et al., 2019;
Sachs et al., 2018) reports were used. If the interpretation
of implicit targets is different, the SDSN values, which are
applied on a global context, were adopted.
2. For non-SDG indicators, the targets suggested in scientific
literature and reports from international organizations were
used.
3. For SDG indicators not included in the OECD and SDSN
reports, the mean of the top five performers was used.
4. For non-SDG indicators with no available information
from the literature and reports, the mean of the top five
performers was used.
Criteria 3 and 4 follow methods that were used in other global
indices such as SDSN’s SDG Index (Sachs et al., 2019; Sachs et al.,
2018) and UNEP’s Green Economy Progress (GEP) (PAGE, 2017b,
2017a). The details on the sustainability targets used to benchmark
the indicators of the 2020 Green Growth Index are discussed in
Chapter 5.3.3 Sustainability targets.
1.3 Purpose and structure of
the report
Considering the significant updates on the 2020 Green Growth
Index with the replacement of about 28% of the 36 indicators, the
country performances from last year’s report on the Index cannot
be compared to those from this year. This is a common practice for
global indices particularly when the development process evolved
over years, as also is the case for the following global indices:
Human Development Index (HDI)
“Because national and international agencies continually improve
their data series, the data—including the HDI values and ranks—
presented in this report are not comparable to those published in
earlier editions.” (UNDP, 2019: p. 295)
“It is misleading to compare values and rankings with those of
previously published reports, because of revisions and updates
of the underlying data and adjustments to goalposts.” (UNDP,
2018: p. 1)
SDG Index
“Since the indicators, data, and methodology have been revised
for the 2018 Index, the rankings and scores are not comparable
with the 2017 and 2016 editions. Therefore, a change in a
country’s ranking does not necessarily signify a change in its SDG
performance.” (Sachs et al., 2018: p. 11)
“Due to changes in the indicators and some refinements in
the methodology, SDG Index rankings and scores cannot be
compared across the 2016, 2017 and 2018 editions of the report.” (Sachs et al., 2018: p. 36)
Environmental Performance Index (EPI)
“Changes in methodology between versions of the EPI mean that
historical EPI scores are not comparable. Differences in EPI scores
across EPI iterations are largely due to additions and subtractions
of indicators, new weighting schemes, and other aspects of
the methodology—not necessarily to decreased or increased
performance.” (Wendling et al., 2018: p. 10)
To allow comparison of scores and ranks over time, this edition of
the report includes trends in the Green Growth Index – comparing
changes in their green growth performance in the last one and a half
decades. The 2020 Green Growth Index presents the results for
about 117 countries from 2005 to 2019, including key highlights
on differences in green growth performance among countries
and regions, and across dimensions and indicators. Details on the
concept and methods for developing the Green Growth Index were
already discussed in the previous report and will not be repeated
here. Only the summary of the methods is presented to enable
readers and users of this report to understand the context for
developing the Index (Appendix 1). The structure of the report is as
follows:
Chapter 1 briefly describes the concept of the Green Growth Index
and explains the improvements made on its indicator framework.
This chapter also briefly mentions the experts who contributed to
the review of the indicator framework.
Chapter 2 provides a global overview of the Green Growth Index
and its dimensions using maps to present a bird’s eye view of the
countries’ green growth performance. This chapter also presents
country and subregional dashboards on the Index, dimensions, and
indicators to provide contexts to the geographical differences in
performance.
Chapter 3 presents the regional outlook of the Green Growth Index
with a special focus on the performance of regions on the four green
growth dimensions and the trend in performance from 2005 to
2019.
Chapter 4 presents the pattern of distribution of the Green Growth
Index scores by region and discusses the performance of top
performing countries in each region.
Chapter 5 provides details of the expert consultations that were
conducted to review the green growth indicators for the 2020
Green Growth Index. This chapter describes the online survey
and feedback collected from experts from this survey as well as
challenges that need attention in the next steps forward.
Chapter 6 presents the projects at GGGI which will apply the Green
Growth Index and its Simulation Tool to support GGGI Member
Countries and its Regional Partners to support greening of National
Development Plans and Framework and assess co-benefits from
COVID Green Recovery Plans.
Chapter 7 provides the detailed results of the Green Growth Index
for each country, including those which cannot be ranked due to lack
of data for some green growth indicators. This chapter presents
tables of the Index, dimensions, indicator categories, and normalized
indicators for all countries and classified by regions.